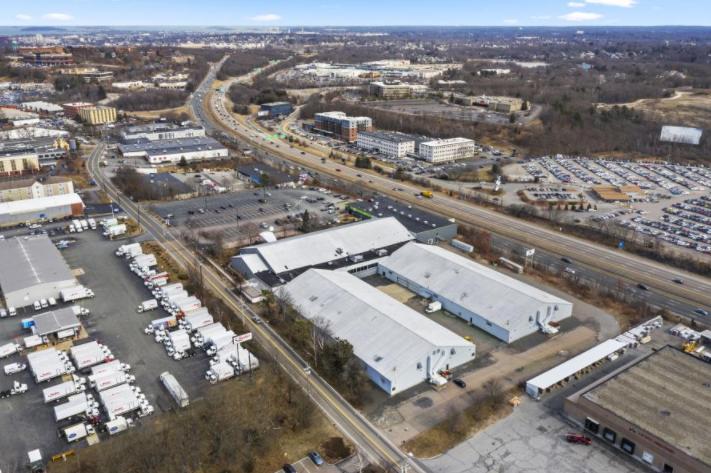
1-Mile | 3-Miles | 5-Miles | ||
---|---|---|---|---|
Total Population | 3,070 | 79,888 | 302,058 | |
Population Median Age | 38 | 40 | 40 | |
Population by Age | 0-9 Yrs | 427 (13%) | 9153 (11%) | 32098 (10%) |
10-19 Yrs | 351 (11%) | 7878 (9%) | 32088 (10%) | |
20-29 Yrs | 387 (12%) | 11258 (14%) | 43462 (14%) | |
30-39 Yrs | 449 (14%) | 12236 (15%) | 43672 (14%) | |
40-49 Yrs | 464 (15%) | 9697 (12%) | 39153 (12%) | |
50-59 Yrs | 428 (13%) | 11784 (14%) | 42081 (13%) | |
60-69 Yrs | 289 (9%) | 9347 (11%) | 35764 (11%) | |
70+ Yrs | 276 (8%) | 8535 (10%) | 33738 (11%) | |
Median HH Income | $101,669 | $87,327 | $81,388 | |
Total Household Income | < 24K | 87 (7%) | 4931 (15%) | 21207 (18%) |
25-49K | 136 (12%) | 4481 (14%) | 17097 (14%) | |
50-74K | 100 (8%) | 3999 (12%) | 16212 (13%) | |
75-99K | 229 (20%) | 4728 (15%) | 16204 (13%) | |
100-199K | 371 (32%) | 9844 (31%) | 33765 (28%) | |
200K+ | 205 (18%) | 3502 (11%) | 12828 (10%) | |
Highest Education Level | No Diploma | 94 | 5586 | 23581 |
Diploma or GED | 558 | 13972 | 55669 | |
Some College | 303 | 8378 | 35509 | |
Assoc. Degree | 205 | 4400 | 16519 | |
Bachelors Degree | 633 | 16011 | 53302 | |
Higher Degree | 364 | 10118 | 34736 | |
Total Housing Units | 1,164 | 33,067 | 124,203 | |
--Owner-Occupied | 745 | 18,940 | 66,671 | |
--Renter-Occupied | 383 | 12,545 | 50,643 | |
Owner-Occupied Values | < 100K | 6 | 339 | 1141 |
100-199K | 3 | 669 | 1667 | |
200-299K | 49 | 2519 | 8626 | |
300-399K | 186 | 4791 | 18291 | |
400-499K | 222 | 4054 | 15822 | |
500K+ | 280 | 6568 | 21124 | |
Total Working Age Population | 2,443 | 65,981 | 251,183 | |
In Work Force | 1,798 | 46,405 | 174,632 | |
Not In Work Force | 645 | 19,576 | 76,551 | |
Workforce Employed | 1,691 | 43,820 | 164,351 | |
Workforce Unemployed | 107 | 2,524 | 9,996 | |
Civlian Workforce | 1,798 | 46,344 | 174,347 | |
Military Workforce | 0 | 61 | 286 | |
Total Households | 1,128 | 31,485 | 117,313 | |
Family Households | 816 | 19,433 | 72,263 | |
Non-Family Households | 312 | 12,052 | 45,051 | |
Married Couple | 722 | 14,772 | 50,916 | |
Other Family | 94 | 4,661 | 21,347 | |
Married w/Child | 338 | 6,176 | 20,609 | |
Single Male w/Child | 6 | 280 | 1,601 | |
Single Female w/Child | 16 | 1,474 | 6,689 |
Population Change Last Two Decades - Plus Projection
2000 | % | 2010 | % | 2020 | % | 2030 | |
---|---|---|---|---|---|---|---|
Massachusetts | 6,349,097 | +3 | 6,547,629 | +6 | 6,933,887 | +4 | 7,225,472 |
Middlesex County | 1,465,396 | +3 | 1,503,085 | +7 | 1,613,961 | +5 | 1,686,641 |
Norfolk County | 650,308 | +3 | 670,850 | +7 | 718,394 | +7 | 765,912 |
Plymouth County | 472,822 | +5 | 494,919 | +5 | 518,508 | +3 | 534,464 |
Suffolk County | 689,807 | +5 | 722,023 | +14 | 821,840 | +10 | 900,586 |
Total Working Age Population:
Total Households:
Total Working Age Population:
Total Households:
Total Working Age Population:
Total Households: