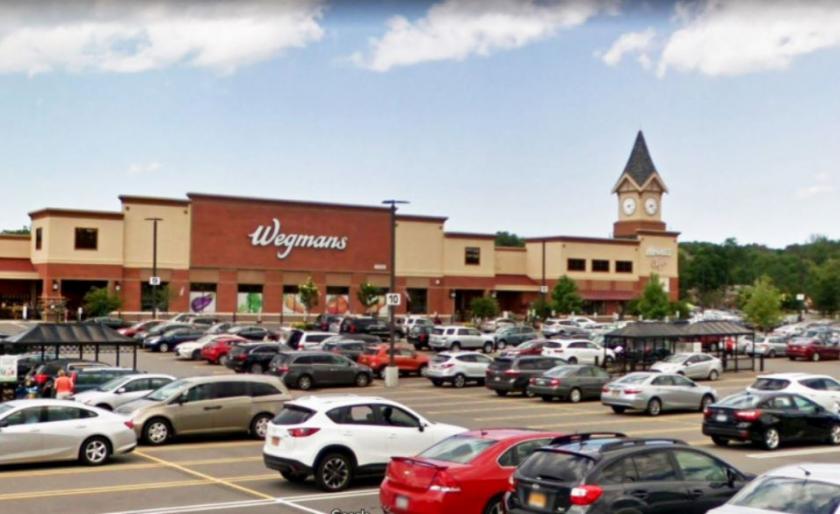
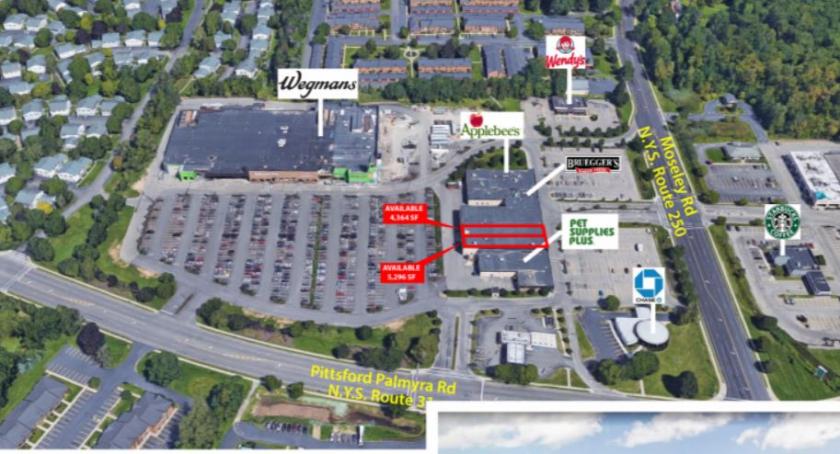
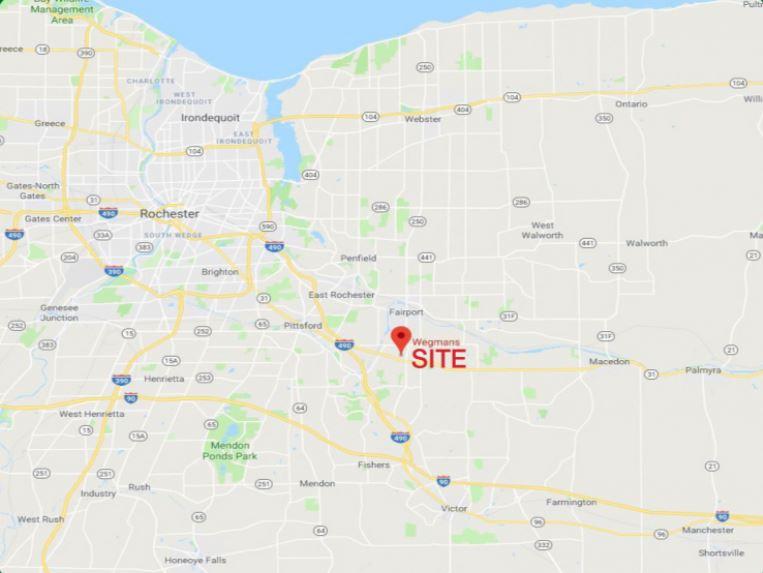
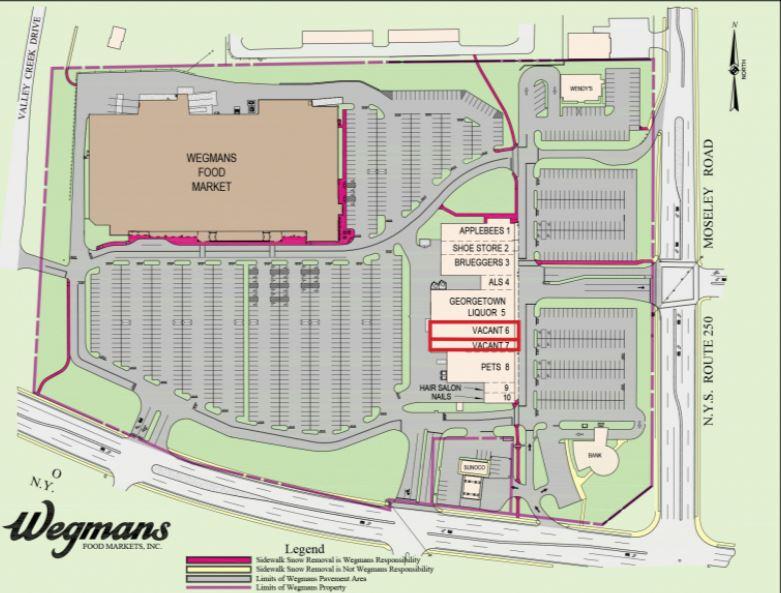
1-Mile | 3-Miles | 5-Miles | ||
---|---|---|---|---|
Total Population | 7,105 | 42,644 | 93,344 | |
Population Median Age | 45 | 44 | 42 | |
Population by Age | 0-9 Yrs | 760 (10%) | 4567 (10%) | 10221 (10%) |
10-19 Yrs | 683 (9%) | 5030 (11%) | 12469 (13%) | |
20-29 Yrs | 602 (8%) | 3664 (8%) | 8415 (9%) | |
30-39 Yrs | 819 (11%) | 4656 (10%) | 10029 (10%) | |
40-49 Yrs | 871 (12%) | 5329 (12%) | 11416 (12%) | |
50-59 Yrs | 914 (12%) | 6543 (15%) | 14100 (15%) | |
60-69 Yrs | 1067 (15%) | 6150 (14%) | 13195 (14%) | |
70+ Yrs | 1388 (19%) | 6706 (15%) | 13499 (14%) | |
Median HH Income | $79,114 | $87,486 | $88,282 | |
Total Household Income | < 24K | 457 (14%) | 2195 (12%) | 4484 (11%) |
25-49K | 572 (17%) | 2469 (13%) | 5812 (15%) | |
50-74K | 519 (15%) | 3002 (16%) | 6030 (16%) | |
75-99K | 488 (14%) | 2469 (13%) | 4698 (12%) | |
100-199K | 937 (28%) | 5780 (32%) | 11784 (31%) | |
200K+ | 284 (8%) | 1884 (10%) | 4836 (12%) | |
Highest Education Level | No Diploma | 99 | 1044 | 2512 |
Diploma or GED | 595 | 3873 | 8428 | |
Some College | 792 | 4415 | 9143 | |
Assoc. Degree | 639 | 3508 | 6763 | |
Bachelors Degree | 1741 | 9869 | 20273 | |
Higher Degree | 1477 | 8779 | 19273 | |
Total Housing Units | 3,544 | 18,814 | 40,100 | |
--Owner-Occupied | 2,488 | 14,145 | 29,854 | |
--Renter-Occupied | 768 | 3,655 | 7,789 | |
Owner-Occupied Values | < 100K | 304 | 717 | 2228 |
100-199K | 980 | 6265 | 10827 | |
200-299K | 872 | 4820 | 9958 | |
300-399K | 277 | 1467 | 3974 | |
400-499K | 45 | 533 | 1518 | |
500K+ | 9 | 342 | 1349 | |
Total Working Age Population | 5,865 | 34,755 | 75,573 | |
In Work Force | 3,574 | 21,815 | 47,930 | |
Not In Work Force | 2,291 | 12,940 | 27,643 | |
Workforce Employed | 3,454 | 21,161 | 46,393 | |
Workforce Unemployed | 119 | 649 | 1,515 | |
Civlian Workforce | 3,574 | 21,810 | 47,908 | |
Military Workforce | 0 | 5 | 22 | |
Total Households | 3,257 | 17,799 | 37,643 | |
Family Households | 2,016 | 12,405 | 25,963 | |
Non-Family Households | 1,241 | 5,394 | 11,680 | |
Married Couple | 1,629 | 10,199 | 21,570 | |
Other Family | 387 | 2,206 | 4,393 | |
Married w/Child | 479 | 3,372 | 7,787 | |
Single Male w/Child | 51 | 177 | 605 | |
Single Female w/Child | 195 | 1,015 | 1,914 |
Population Change Last Two Decades - Plus Projection
2000 | % | 2010 | % | 2020 | % | 2030 | |
---|---|---|---|---|---|---|---|
New York | 18,976,457 | +2 | 19,378,102 | +4 | 20,146,131 | +2 | 20,604,030 |
Monroe County | 735,343 | +1 | 744,344 | +1 | 754,529 | +1 | 758,536 |
Ontario County | 100,224 | +8 | 107,931 | +3 | 111,349 | +3 | 114,374 |
Wayne County | 93,765 | 0 | 93,772 | -4 | 89,564 | -3 | 86,754 |
Total Working Age Population:
Total Households:
Total Working Age Population:
Total Households:
Total Working Age Population:
Total Households: