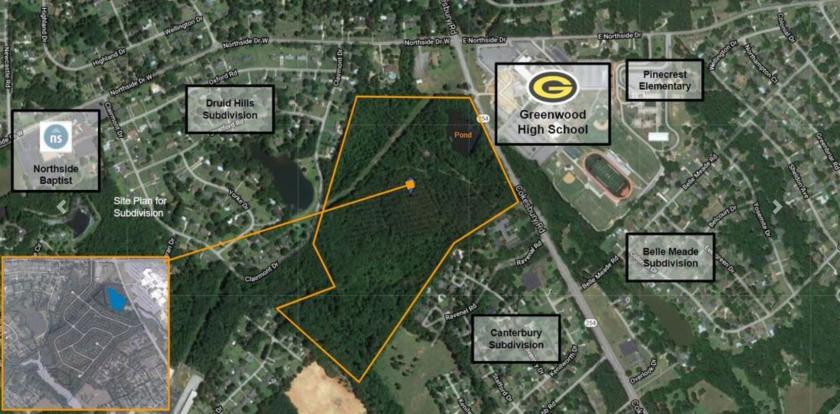
1807 Cokesbury Road Greenwood, SC 29649


O: 864-992-9379
loudon.brooks@svn.com


| 1-Mile | 3-Miles | 5-Miles | ||
|---|---|---|---|---|
| Total Population | 4,010 | 23,744 | 40,754 | |
| Population Median Age | 39 | 38 | 39 | |
| Population by Age | 0-9 Yrs | 451 (11%) | 2705 (11%) | 4792 (11%) |
| 10-19 Yrs | 425 (10%) | 3171 (13%) | 5478 (13%) | |
| 20-29 Yrs | 658 (16%) | 4310 (18%) | 6032 (14%) | |
| 30-39 Yrs | 610 (15%) | 2995 (12%) | 5317 (13%) | |
| 40-49 Yrs | 527 (13%) | 2639 (11%) | 4937 (12%) | |
| 50-59 Yrs | 437 (10%) | 2897 (12%) | 4977 (12%) | |
| 60-69 Yrs | 361 (9%) | 2253 (9%) | 4385 (10%) | |
| 70+ Yrs | 541 (13%) | 2774 (11%) | 4835 (11%) | |
| Median HH Income | $54,926 | $45,764 | $43,504 | |
| Total Household Income | < 24K | 431 (26%) | 2658 (28%) | 4675 (28%) |
| 25-49K | 313 (19%) | 2367 (25%) | 4575 (28%) | |
| 50-74K | 243 (14%) | 1644 (17%) | 2612 (16%) | |
| 75-99K | 239 (14%) | 1122 (12%) | 1748 (10%) | |
| 100-199K | 315 (19%) | 1256 (13%) | 2056 (12%) | |
| 200K+ | 80 (4%) | 281 (3%) | 474 (2%) | |
| Highest Education Level | No Diploma | 160 | 1663 | 3846 |
| Diploma or GED | 540 | 3967 | 7694 | |
| Some College | 413 | 2734 | 4691 | |
| Assoc. Degree | 474 | 1974 | 3072 | |
| Bachelors Degree | 794 | 3310 | 5252 | |
| Higher Degree | 382 | 1761 | 2692 | |
| Total Housing Units | 1,718 | 10,267 | 18,144 | |
| --Owner-Occupied | 1,018 | 5,460 | 9,714 | |
| --Renter-Occupied | 603 | 3,869 | 6,427 | |
| Owner-Occupied Values | < 100K | 188 | 1671 | 3262 |
| 100-199K | 697 | 2610 | 4040 | |
| 200-299K | 88 | 775 | 1390 | |
| 300-399K | 40 | 192 | 462 | |
| 400-499K | 1 | 94 | 266 | |
| 500K+ | 5 | 118 | 293 | |
| Total Working Age Population | 3,240 | 19,292 | 32,914 | |
| In Work Force | 2,104 | 12,075 | 20,025 | |
| Not In Work Force | 1,136 | 7,217 | 12,889 | |
| Workforce Employed | 1,945 | 11,224 | 18,564 | |
| Workforce Unemployed | 152 | 826 | 1,424 | |
| Civlian Workforce | 2,097 | 12,050 | 19,988 | |
| Military Workforce | 7 | 24 | 37 | |
| Total Households | 1,621 | 9,329 | 16,141 | |
| Family Households | 1,025 | 5,515 | 10,009 | |
| Non-Family Households | 596 | 3,813 | 6,132 | |
| Married Couple | 751 | 3,479 | 6,195 | |
| Other Family | 274 | 2,036 | 3,814 | |
| Married w/Child | 292 | 1,182 | 2,102 | |
| Single Male w/Child | 11 | 188 | 421 | |
| Single Female w/Child | 177 | 1,062 | 1,772 | |
Population Change Last Two Decades - Plus Projection
| 2000 | % | 2010 | % | 2020 | % | 2030 | |
|---|---|---|---|---|---|---|---|
| South Carolina | 4,012,012 | +15 | 4,625,364 | +9 | 5,020,400 | +9 | 5,488,460 |
| Abbeville County | 26,167 | -3 | 25,417 | +9 | 27,580 | +5 | 29,070 |
| Greenwood County | 66,271 | +5 | 69,661 | +7 | 74,840 | +7 | 79,750 |
| Laurens County | 69,567 | -4 | 66,537 | +21 | 80,220 | +9 | 87,660 |
Total Working Age Population:
Total Households:
Total Working Age Population:
Total Households:
Total Working Age Population:
Total Households: