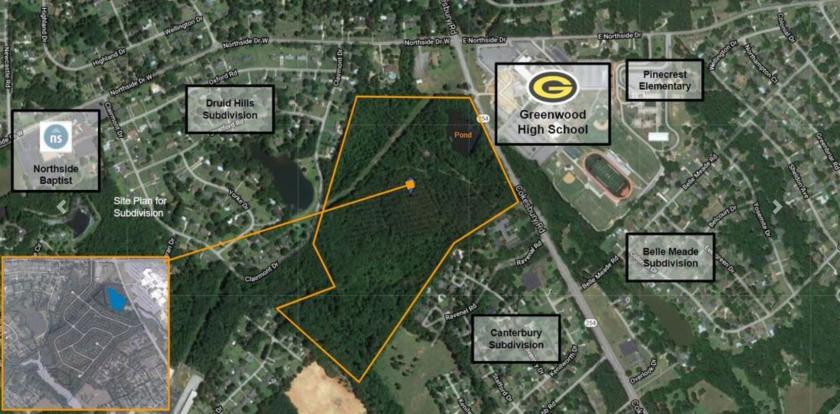
Greenwood SC is on the Move! SVN Blackstream is pleased to offer this development opportunity! Greenwood County has generated over $1.14 billion worth of investments and 1,142 jobs since 2013. Greenwood County has recently prospered with $130 million of outside capital investment to include the Clemson Genetic Center and Teijin Automotive among others. Greenville Business Magazine, stated that Greenwood is a significant employer of citizens both within the county and many who commute in during the week and according to the Greenwood City/County Comprehensive Plan 2035, the population of the city of Greenwood increases some 29.5 percent during the week due to this influx of workers from other counties. The population of the county overall, about 70,000 people, also increases by 2.6 percent during the work week. This opens our eyes to huge opportunity and need for residential development. Uptown Greenwood is ripe with new businesses, artisans, retail shops, and locally owned restaurants. Uptown offers a rich history, appealing architecture, beautiful landscape, progressive business climate, and high traffic count. Numerous award winning festivals and outdoor events are held throughout the year that attract large crowds like during Festival of Flowers.HighlightsEstimated ±77.52 acresLevel TopographyAll public utilities available nearbySpring fed pondWalking distance to Greenwood High and Pinecrest Elementary SchoolsInfill Location surrounded by well established neighborhoods