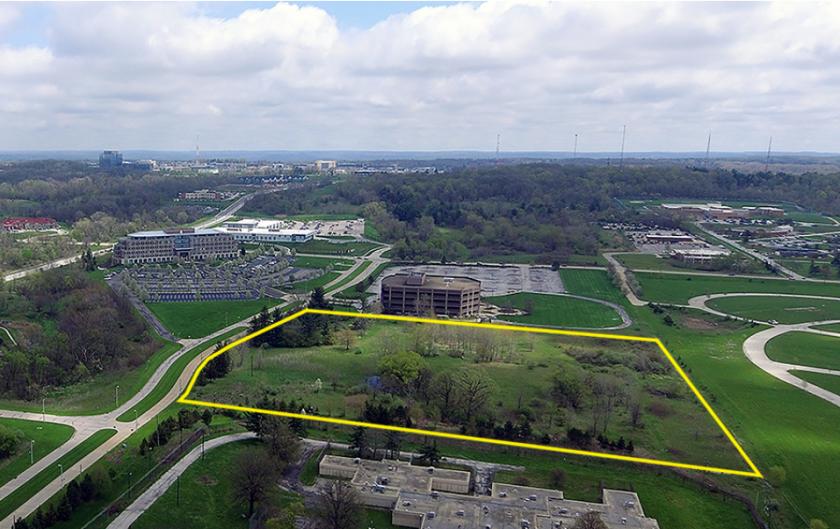
1-Mile | 3-Miles | 5-Miles | ||
---|---|---|---|---|
Total Population | 6,638 | 85,138 | 241,588 | |
Population Median Age | 40 | 40 | 41 | |
Population by Age | 0-9 Yrs | 1149 (17%) | 10719 (12%) | 28127 (11%) |
10-19 Yrs | 679 (10%) | 11328 (13%) | 30516 (12%) | |
20-29 Yrs | 908 (13%) | 9986 (11%) | 30620 (12%) | |
30-39 Yrs | 689 (10%) | 9650 (11%) | 29187 (12%) | |
40-49 Yrs | 605 (9%) | 10071 (11%) | 28291 (11%) | |
50-59 Yrs | 755 (11%) | 11089 (13%) | 31991 (13%) | |
60-69 Yrs | 808 (12%) | 10799 (12%) | 30793 (12%) | |
70+ Yrs | 1045 (15%) | 11494 (13%) | 32062 (13%) | |
Median HH Income | $33,129 | $49,058 | $49,464 | |
Total Household Income | < 24K | 1094 (37%) | 9042 (25%) | 27084 (26%) |
25-49K | 869 (29%) | 9214 (25%) | 25140 (24%) | |
50-74K | 468 (15%) | 5852 (16%) | 17265 (16%) | |
75-99K | 263 (8%) | 3859 (10%) | 11209 (10%) | |
100-199K | 222 (7%) | 5027 (14%) | 15473 (14%) | |
200K+ | 30 (1%) | 2901 (8%) | 7376 (7%) | |
Highest Education Level | No Diploma | 489 | 4888 | 14660 |
Diploma or GED | 1502 | 14970 | 43865 | |
Some College | 1386 | 13325 | 36960 | |
Assoc. Degree | 335 | 4965 | 13800 | |
Bachelors Degree | 414 | 9168 | 27939 | |
Higher Degree | 263 | 10706 | 30615 | |
Total Housing Units | 3,290 | 40,582 | 121,104 | |
--Owner-Occupied | 1,125 | 20,585 | 60,207 | |
--Renter-Occupied | 1,821 | 15,309 | 43,340 | |
Owner-Occupied Values | < 100K | 860 | 10784 | 29947 |
100-199K | 221 | 3770 | 14673 | |
200-299K | 28 | 2253 | 6175 | |
300-399K | 8 | 1638 | 3610 | |
400-499K | 5 | 1002 | 2475 | |
500K+ | 3 | 1138 | 3326 | |
Total Working Age Population | 5,147 | 67,955 | 195,765 | |
In Work Force | 2,753 | 42,244 | 121,422 | |
Not In Work Force | 2,394 | 25,711 | 74,343 | |
Workforce Employed | 2,522 | 38,193 | 110,857 | |
Workforce Unemployed | 231 | 4,043 | 10,502 | |
Civlian Workforce | 2,753 | 42,235 | 121,358 | |
Military Workforce | 0 | 9 | 63 | |
Total Households | 2,946 | 35,894 | 103,547 | |
Family Households | 1,650 | 21,550 | 59,666 | |
Non-Family Households | 1,297 | 14,344 | 43,881 | |
Married Couple | 581 | 11,662 | 34,907 | |
Other Family | 1,068 | 9,888 | 24,759 | |
Married w/Child | 115 | 4,318 | 12,146 | |
Single Male w/Child | 93 | 520 | 1,748 | |
Single Female w/Child | 493 | 4,298 | 10,108 |
Population Change Last Two Decades - Plus Projection
2000 | % | 2010 | % | 2020 | % | 2030 | |
---|---|---|---|---|---|---|---|
Ohio | 11,353,140 | +2 | 11,536,504 | 0 | 11,574,870 | 0 | 11,615,100 |
Cuyahoga County | 1,393,978 | -8 | 1,280,122 | -6 | 1,209,550 | -5 | 1,154,210 |
Total Working Age Population:
Total Households:
Total Working Age Population:
Total Households:
Total Working Age Population:
Total Households: