Features
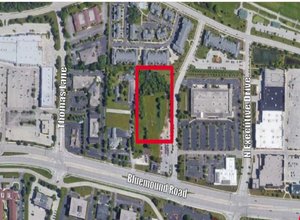
• Ideal development site with possible uses including hospitality, service, retail, and flex
• Lots can be divided to accommodate specific size requirement
• Highly visible with easy access from HWY 151
• 20 minute drive to downtown Madison
• Close proximity to EPIC Headquarters, new Verona High School development, and Veridian Home Expansion
Basic Details:
Land Acreage: 9.71 Acres
Land Square Footage: 422,967 SF
Price Per Acre: $400,000 / AC
No part of this information may be copied, reproduced, repurposed, or screen-captured for any commercial purpose without prior written authorization from MyEListing.
While we strive to provide the most accurate information, all listing information, and demographic data, is provided by third-parties. As such, MyEListing will not be responsible for the accuracy of the information. It is strongly recommended that you verify all information with the listing agent, and any relevant agencies, prior to making any decisions.
How much land does the Verona, WI property at 200 Paoli St include?
200 Paoli St in Verona includes 9.710 acres of land
What kind of Land is the propery at 200 Paoli St?
The property at 200 Paoli St Verona, WI 53593 is listed as a Mixed Use Land Land property
What is the population within 1 mile of 200 Paoli St in Verona?
The population within 1 mile of 200 Paoli St Verona, WI 53593 is 2,997 people.
Who do I contact for questions about 200 Paoli St?
You should contact the listing agent,
Nathan Powers, for any details regarding this commercial listing.