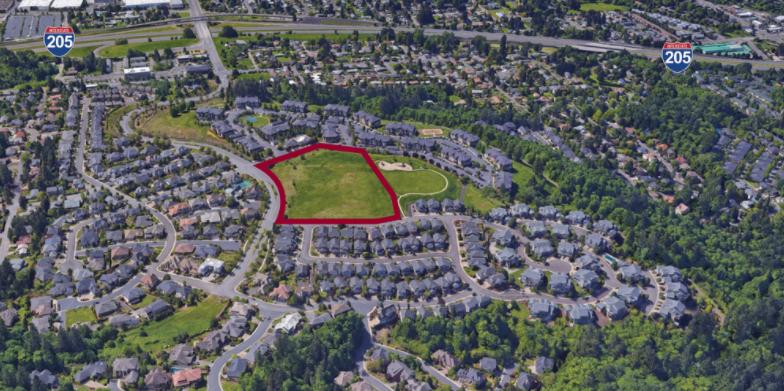
1-Mile | 3-Miles | 5-Miles | ||
---|---|---|---|---|
Total Population | 10,260 | 138,490 | 374,522 | |
Population Median Age | 40 | 38 | 38 | |
Population by Age | 0-9 Yrs | 950 (9%) | 15924 (11%) | 43181 (11%) |
10-19 Yrs | 1195 (11%) | 15966 (11%) | 40497 (10%) | |
20-29 Yrs | 1383 (13%) | 20407 (14%) | 54794 (14%) | |
30-39 Yrs | 1405 (13%) | 23909 (17%) | 64375 (17%) | |
40-49 Yrs | 1677 (16%) | 19330 (13%) | 52576 (14%) | |
50-59 Yrs | 1350 (13%) | 17162 (12%) | 44893 (11%) | |
60-69 Yrs | 1285 (12%) | 14085 (10%) | 40681 (10%) | |
70+ Yrs | 1015 (9%) | 11707 (8%) | 33525 (8%) | |
Median HH Income | $73,816 | $67,781 | $67,529 | |
Total Household Income | < 24K | 499 (12%) | 8112 (15%) | 23780 (16%) |
25-49K | 912 (22%) | 10485 (20%) | 28712 (20%) | |
50-74K | 604 (15%) | 9622 (18%) | 26177 (18%) | |
75-99K | 562 (14%) | 7935 (15%) | 20419 (14%) | |
100-199K | 962 (24%) | 11948 (23%) | 33952 (23%) | |
200K+ | 429 (10%) | 2950 (5%) | 9490 (6%) | |
Highest Education Level | No Diploma | 722 | 11177 | 27180 |
Diploma or GED | 1271 | 22134 | 54756 | |
Some College | 1782 | 23607 | 63665 | |
Assoc. Degree | 691 | 8509 | 22337 | |
Bachelors Degree | 1895 | 20858 | 62645 | |
Higher Degree | 1055 | 10914 | 36735 | |
Total Housing Units | 4,137 | 53,307 | 149,630 | |
--Owner-Occupied | 2,277 | 31,016 | 84,690 | |
--Renter-Occupied | 1,691 | 20,035 | 57,840 | |
Owner-Occupied Values | < 100K | 93 | 1355 | 4372 |
100-199K | 134 | 2459 | 5686 | |
200-299K | 357 | 8475 | 19208 | |
300-399K | 557 | 9720 | 23996 | |
400-499K | 595 | 5019 | 15061 | |
500K+ | 542 | 3987 | 16367 | |
Total Working Age Population | 8,563 | 112,599 | 307,060 | |
In Work Force | 5,685 | 77,085 | 208,694 | |
Not In Work Force | 2,878 | 35,514 | 98,366 | |
Workforce Employed | 5,418 | 73,343 | 197,625 | |
Workforce Unemployed | 267 | 3,723 | 10,842 | |
Civlian Workforce | 5,685 | 77,066 | 208,467 | |
Military Workforce | 0 | 19 | 227 | |
Total Households | 3,968 | 51,051 | 142,529 | |
Family Households | 2,418 | 31,736 | 86,493 | |
Non-Family Households | 1,551 | 19,316 | 56,037 | |
Married Couple | 1,899 | 23,128 | 63,887 | |
Other Family | 519 | 8,607 | 22,605 | |
Married w/Child | 689 | 9,613 | 26,616 | |
Single Male w/Child | 99 | 1,195 | 3,112 | |
Single Female w/Child | 208 | 3,319 | 8,434 |
Population Change Last Two Decades - Plus Projection
2000 | % | 2010 | % | 2020 | % | 2030 | |
---|---|---|---|---|---|---|---|
Oregon | 3,421,399 | +12 | 3,831,074 | +11 | 4,264,810 | +11 | 4,727,438 |
Multnomah County | 660,486 | +11 | 735,334 | +12 | 822,675 | +10 | 906,904 |
Clackamas County | 338,391 | +11 | 375,992 | +14 | 428,860 | +14 | 490,011 |
Total Working Age Population:
Total Households:
Total Working Age Population:
Total Households:
Total Working Age Population:
Total Households: