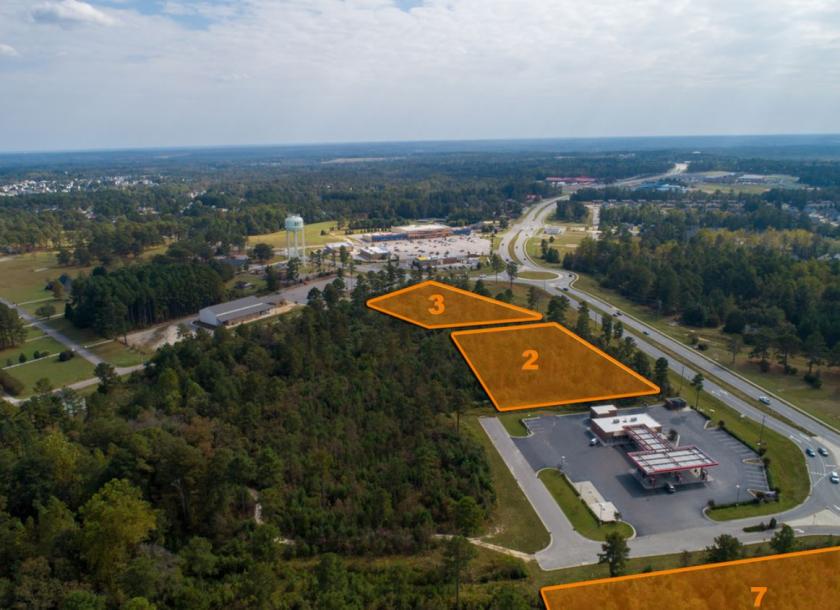
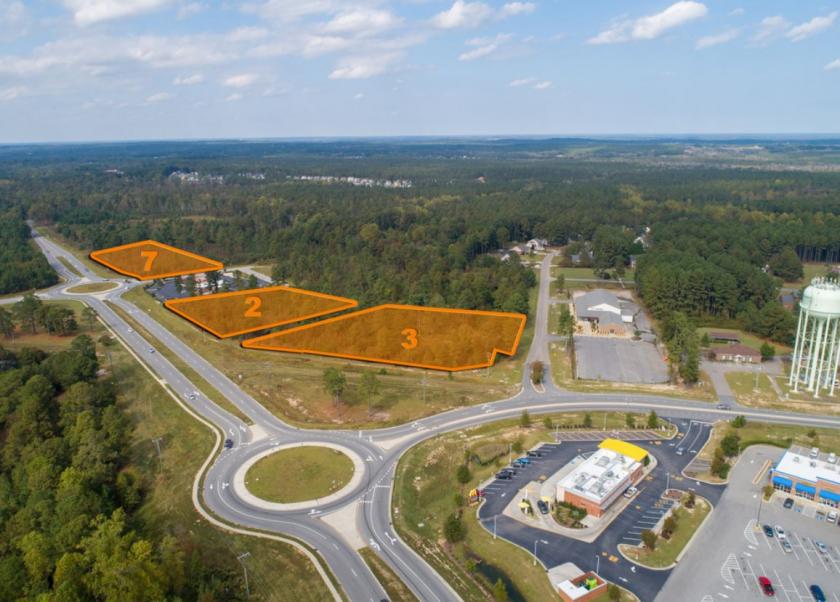
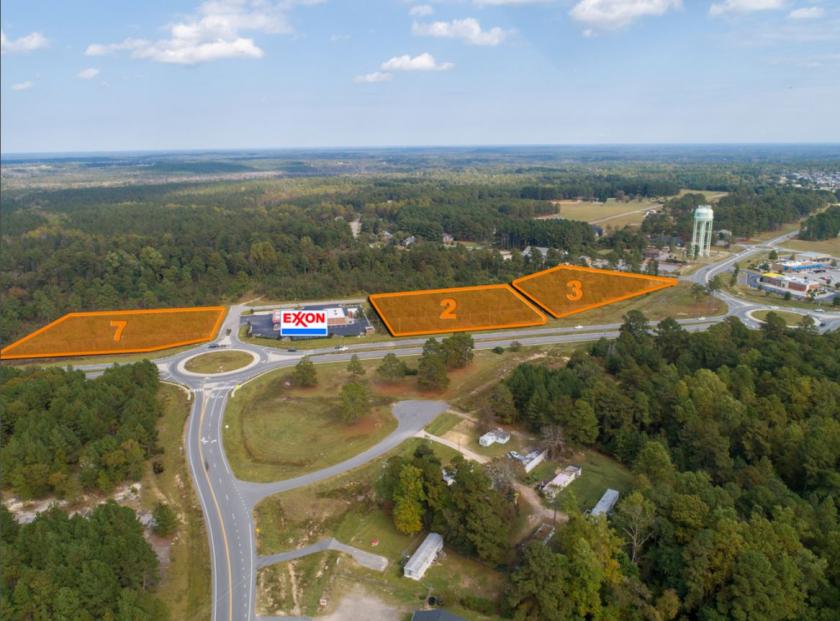
1-Mile | 3-Miles | 5-Miles | ||
---|---|---|---|---|
Total Population | 1,843 | 16,120 | 34,700 | |
Population Median Age | 31 | 31 | 31 | |
Population by Age | 0-9 Yrs | 366 (19%) | 3226 (20%) | 6840 (19%) |
10-19 Yrs | 312 (16%) | 2594 (16%) | 5196 (14%) | |
20-29 Yrs | 231 (12%) | 2197 (13%) | 5122 (14%) | |
30-39 Yrs | 347 (18%) | 2955 (18%) | 6379 (18%) | |
40-49 Yrs | 206 (11%) | 1952 (12%) | 4196 (12%) | |
50-59 Yrs | 192 (10%) | 1612 (10%) | 3506 (10%) | |
60-69 Yrs | 132 (7%) | 1027 (6%) | 2027 (5%) | |
70+ Yrs | 56 (3%) | 558 (3%) | 1435 (4%) | |
Median HH Income | $67,389 | $69,226 | $68,979 | |
Total Household Income | < 24K | 86 (15%) | 741 (14%) | 1656 (14%) |
25-49K | 113 (19%) | 938 (18%) | 2170 (19%) | |
50-74K | 124 (21%) | 1079 (21%) | 2259 (20%) | |
75-99K | 83 (14%) | 875 (17%) | 2061 (18%) | |
100-199K | 136 (23%) | 1166 (23%) | 2591 (23%) | |
200K+ | 25 (4%) | 198 (3%) | 353 (3%) | |
Highest Education Level | No Diploma | 76 | 635 | 1330 |
Diploma or GED | 219 | 1928 | 4508 | |
Some College | 300 | 2684 | 5690 | |
Assoc. Degree | 150 | 1357 | 2720 | |
Bachelors Degree | 201 | 1795 | 4075 | |
Higher Degree | 122 | 1105 | 2420 | |
Total Housing Units | 642 | 5,667 | 12,731 | |
--Owner-Occupied | 356 | 3,192 | 6,678 | |
--Renter-Occupied | 211 | 1,805 | 4,412 | |
Owner-Occupied Values | < 100K | 67 | 616 | 1413 |
100-199K | 139 | 1169 | 2249 | |
200-299K | 97 | 1017 | 2225 | |
300-399K | 34 | 258 | 557 | |
400-499K | 14 | 99 | 145 | |
500K+ | 5 | 32 | 88 | |
Total Working Age Population | 1,267 | 11,133 | 24,354 | |
In Work Force | 836 | 7,417 | 16,250 | |
Not In Work Force | 431 | 3,715 | 8,104 | |
Workforce Employed | 613 | 5,383 | 11,837 | |
Workforce Unemployed | 69 | 603 | 1,272 | |
Civlian Workforce | 681 | 5,985 | 13,108 | |
Military Workforce | 155 | 1,432 | 3,142 | |
Total Households | 568 | 4,996 | 11,090 | |
Family Households | 452 | 3,970 | 8,531 | |
Non-Family Households | 115 | 1,027 | 2,559 | |
Married Couple | 334 | 2,888 | 6,506 | |
Other Family | 119 | 1,082 | 2,024 | |
Married w/Child | 177 | 1,589 | 3,478 | |
Single Male w/Child | 22 | 159 | 226 | |
Single Female w/Child | 53 | 568 | 1,183 |
Population Change Last Two Decades - Plus Projection
2000 | % | 2010 | % | 2020 | % | 2030 | |
---|---|---|---|---|---|---|---|
North Carolina | 8,049,313 | +18 | 9,535,483 | +11 | 10,630,691 | +11 | 11,836,070 |
Cumberland County | 302,963 | +5 | 319,431 | +4 | 333,209 | +1 | 335,069 |
Harnett County | 91,025 | +26 | 114,678 | +20 | 137,358 | +15 | 158,563 |
Total Working Age Population:
Total Households:
Total Working Age Population:
Total Households:
Total Working Age Population:
Total Households: