Specialty Real Estate
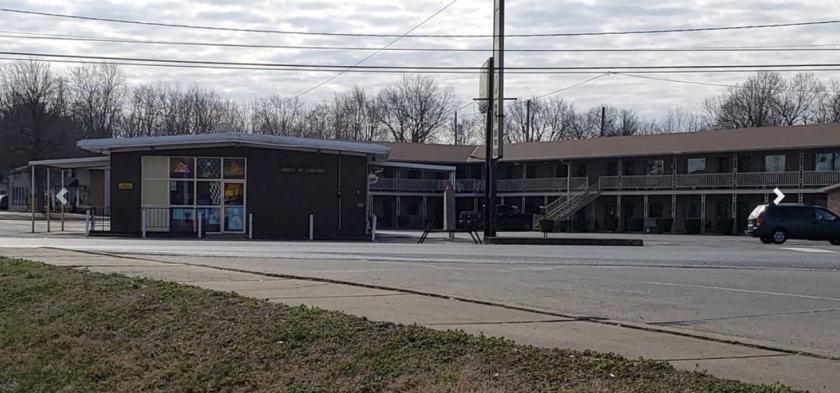
551 U.S. 60 Morganfield, KY 42437
551 U.S. 60 Morganfield, KY 42437

Details & Description
Additional Photos


Listing Agents

Ric DeVore
O: 614-348-2030
ric.devore@e-merge.com
O: 614-348-2030
ric.devore@e-merge.com
While we strive to provide the most accurate information, all listing information, and demographic data, is provided by third-parties. As such, MyEListing will not be responsible for the accuracy of the information. It is strongly recommended that you verify all information with the listing agent, and any relevant agencies, prior to making any decisions.


