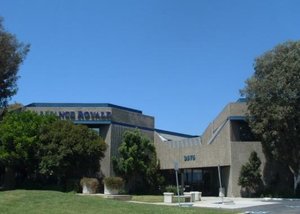
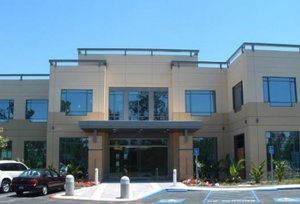
1-Mile | 3-Miles | 5-Miles | ||
---|---|---|---|---|
Total Population | 11,715 | 162,283 | 434,395 | |
Population Median Age | 38 | 36 | 37 | |
Population by Age | 0-9 Yrs | 1249 (10%) | 15223 (9%) | 46239 (10%) |
10-19 Yrs | 981 (8%) | 21831 (13%) | 55862 (12%) | |
20-29 Yrs | 2245 (19%) | 35213 (21%) | 76880 (17%) | |
30-39 Yrs | 2217 (18%) | 27108 (16%) | 64996 (14%) | |
40-49 Yrs | 1372 (11%) | 19154 (11%) | 55318 (12%) | |
50-59 Yrs | 1547 (13%) | 18912 (11%) | 56928 (13%) | |
60-69 Yrs | 1072 (9%) | 12431 (7%) | 39852 (9%) | |
70+ Yrs | 1032 (8%) | 12409 (7%) | 38320 (8%) | |
Median HH Income | $93,268 | $81,421 | $89,839 | |
Total Household Income | < 24K | 720 (14%) | 10083 (16%) | 21275 (14%) |
25-49K | 784 (15%) | 9779 (15%) | 21447 (14%) | |
50-74K | 574 (11%) | 8941 (14%) | 21699 (14%) | |
75-99K | 574 (11%) | 7816 (12%) | 19027 (12%) | |
100-199K | 1554 (31%) | 17076 (27%) | 43887 (28%) | |
200K+ | 788 (15%) | 7926 (12%) | 24098 (15%) | |
Highest Education Level | No Diploma | 388 | 10341 | 39190 |
Diploma or GED | 1014 | 14761 | 42070 | |
Some College | 1935 | 20533 | 53566 | |
Assoc. Degree | 687 | 7211 | 19697 | |
Bachelors Degree | 2828 | 34865 | 86285 | |
Higher Degree | 1783 | 20077 | 53047 | |
Total Housing Units | 5,270 | 66,335 | 164,143 | |
--Owner-Occupied | 2,030 | 21,281 | 71,595 | |
--Renter-Occupied | 2,964 | 40,340 | 79,838 | |
Owner-Occupied Values | < 100K | 52 | 599 | 2099 |
100-199K | 15 | 385 | 1253 | |
200-299K | 17 | 699 | 2278 | |
300-399K | 22 | 877 | 4163 | |
400-499K | 80 | 1506 | 6773 | |
500K+ | 1843 | 17215 | 55030 | |
Total Working Age Population | 9,841 | 137,437 | 358,277 | |
In Work Force | 7,165 | 92,081 | 235,976 | |
Not In Work Force | 2,676 | 45,356 | 122,301 | |
Workforce Employed | 6,869 | 87,305 | 224,953 | |
Workforce Unemployed | 296 | 4,679 | 10,742 | |
Civlian Workforce | 7,165 | 91,985 | 235,696 | |
Military Workforce | 0 | 96 | 280 | |
Total Households | 4,994 | 61,621 | 151,433 | |
Family Households | 2,436 | 32,658 | 93,662 | |
Non-Family Households | 2,557 | 28,963 | 57,771 | |
Married Couple | 1,790 | 24,152 | 71,724 | |
Other Family | 646 | 8,506 | 21,939 | |
Married w/Child | 784 | 9,984 | 30,655 | |
Single Male w/Child | 166 | 1,359 | 3,256 | |
Single Female w/Child | 159 | 2,377 | 5,991 |
Population Change Last Two Decades - Plus Projection
2000 | % | 2010 | % | 2020 | % | 2030 | |
---|---|---|---|---|---|---|---|
California | 33,871,648 | +10 | 37,253,956 | +9 | 40,467,295 | +8 | 43,631,295 |
Orange County | 2,846,289 | +6 | 3,010,232 | +8 | 3,257,087 | +5 | 3,431,096 |
Total Working Age Population:
Total Households:
Total Working Age Population:
Total Households:
Total Working Age Population:
Total Households: