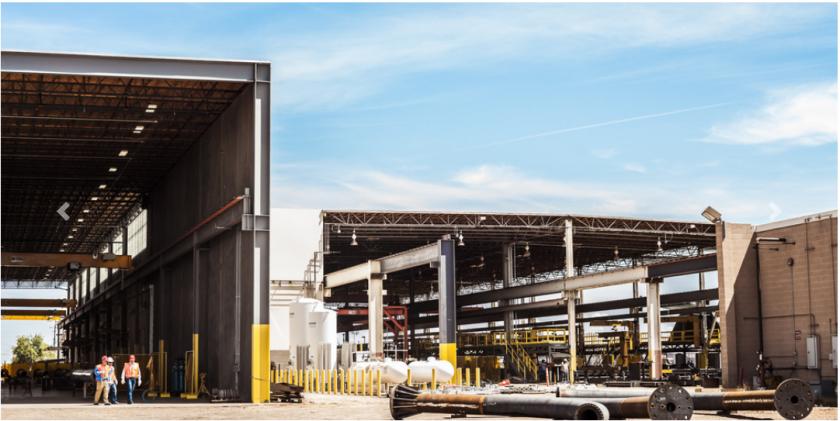
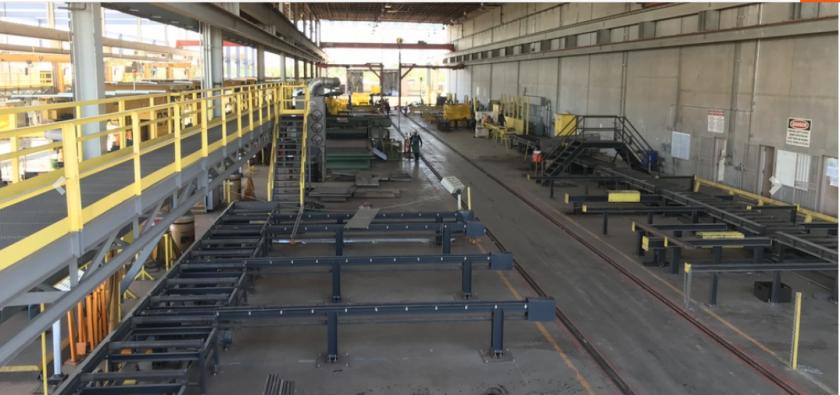
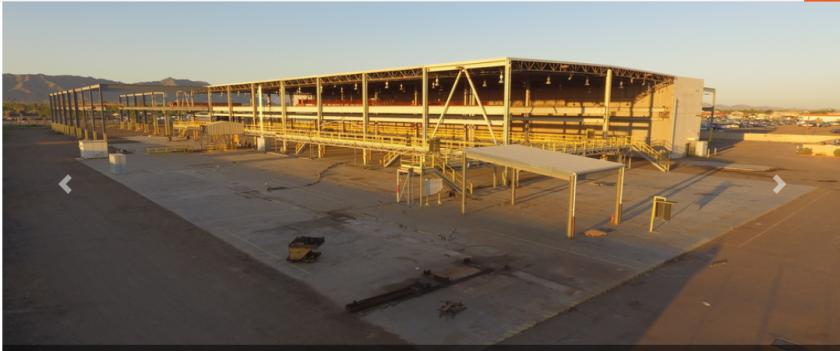
1-Mile | 3-Miles | 5-Miles | ||
---|---|---|---|---|
Total Population | 9,808 | 94,783 | 231,433 | |
Population Median Age | 31 | 32 | 32 | |
Population by Age | 0-9 Yrs | 2060 (21%) | 16510 (17%) | 39276 (16%) |
10-19 Yrs | 1712 (17%) | 15323 (16%) | 36725 (15%) | |
20-29 Yrs | 1472 (15%) | 15999 (16%) | 38347 (16%) | |
30-39 Yrs | 1409 (14%) | 14117 (14%) | 34490 (14%) | |
40-49 Yrs | 946 (9%) | 12026 (12%) | 30046 (12%) | |
50-59 Yrs | 1147 (11%) | 10155 (10%) | 24635 (10%) | |
60-69 Yrs | 517 (5%) | 6302 (6%) | 16487 (7%) | |
70+ Yrs | 546 (5%) | 4351 (4%) | 11426 (4%) | |
Median HH Income | $40,251 | $42,401 | $43,616 | |
Total Household Income | < 24K | 660 (25%) | 7619 (30%) | 20186 (29%) |
25-49K | 855 (33%) | 6416 (25%) | 17213 (25%) | |
50-74K | 548 (21%) | 4612 (18%) | 11575 (17%) | |
75-99K | 258 (10%) | 2706 (10%) | 7014 (10%) | |
100-199K | 219 (8%) | 2853 (11%) | 9521 (14%) | |
200K+ | 30 (1%) | 551 (2%) | 2110 (3%) | |
Highest Education Level | No Diploma | 1944 | 18455 | 40179 |
Diploma or GED | 1589 | 15814 | 36913 | |
Some College | 1004 | 10604 | 27004 | |
Assoc. Degree | 321 | 3304 | 8710 | |
Bachelors Degree | 305 | 4365 | 15470 | |
Higher Degree | 128 | 2162 | 8582 | |
Total Housing Units | 2,781 | 27,470 | 76,026 | |
--Owner-Occupied | 1,601 | 12,872 | 33,961 | |
--Renter-Occupied | 968 | 11,883 | 33,658 | |
Owner-Occupied Values | < 100K | 501 | 4329 | 9170 |
100-199K | 940 | 5318 | 12284 | |
200-299K | 135 | 2455 | 7679 | |
300-399K | 5 | 423 | 2510 | |
400-499K | 9 | 120 | 957 | |
500K+ | 12 | 228 | 1360 | |
Total Working Age Population | 6,821 | 69,265 | 170,561 | |
In Work Force | 3,920 | 40,088 | 104,230 | |
Not In Work Force | 2,901 | 29,177 | 66,331 | |
Workforce Employed | 3,614 | 37,055 | 96,400 | |
Workforce Unemployed | 304 | 2,973 | 7,703 | |
Civlian Workforce | 3,919 | 40,028 | 104,103 | |
Military Workforce | 1 | 60 | 127 | |
Total Households | 2,569 | 24,756 | 67,619 | |
Family Households | 1,993 | 18,377 | 45,860 | |
Non-Family Households | 577 | 6,379 | 21,759 | |
Married Couple | 1,119 | 9,922 | 25,838 | |
Other Family | 874 | 8,455 | 20,022 | |
Married w/Child | 553 | 4,849 | 12,812 | |
Single Male w/Child | 93 | 1,217 | 2,764 | |
Single Female w/Child | 368 | 3,333 | 8,266 |
Population Change Last Two Decades - Plus Projection
2000 | % | 2010 | % | 2020 | % | 2030 | |
---|---|---|---|---|---|---|---|
Arizona | 5,130,632 | +25 | 6,392,017 | +14 | 7,286,100 | +14 | 8,284,900 |
Maricopa County | 3,072,149 | +24 | 3,817,117 | +16 | 4,436,900 | +15 | 5,107,700 |
Total Working Age Population:
Total Households:
Total Working Age Population:
Total Households:
Total Working Age Population:
Total Households: