Industrial Properties
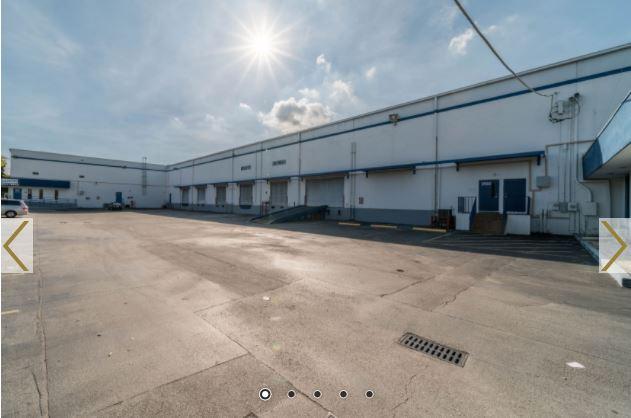
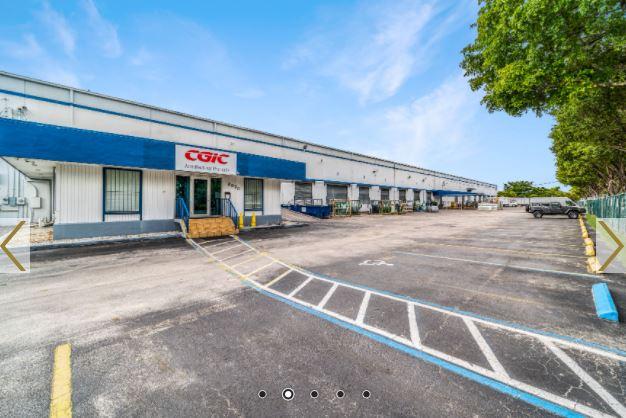
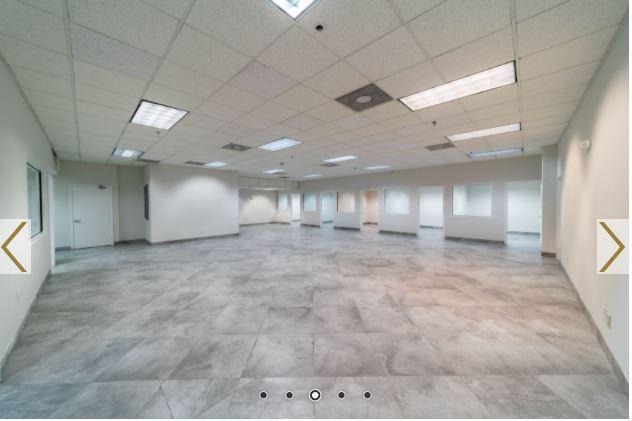
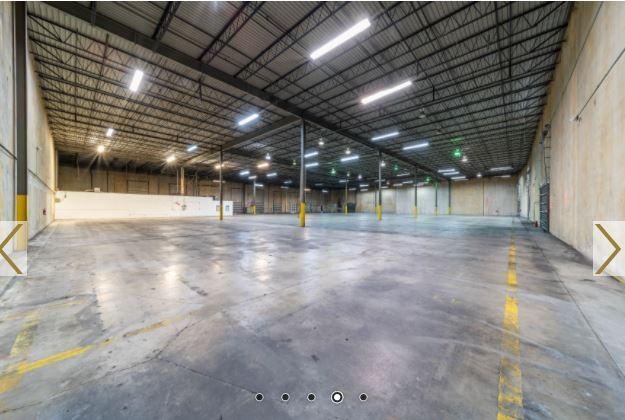
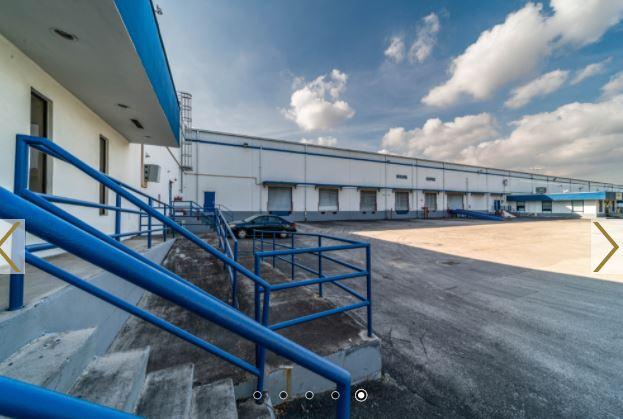
2950 Northwest 75th Avenue Miami, FL 33122
2950 Northwest 75th Avenue Miami, FL 33122
Details & Description
Additional Photos
Listing Agents

Carlos Velasquez
O: 305-817-8899
cvelasquez@vivogroup.net
O: 305-817-8899
cvelasquez@vivogroup.net

Raydel Enriquez
O: 305-817-8899
Renriquez@vivogroup.net
O: 305-817-8899
Renriquez@vivogroup.net
While we strive to provide the most accurate information, all listing information, and demographic data, is provided by third-parties. As such, MyEListing will not be responsible for the accuracy of the information. It is strongly recommended that you verify all information with the listing agent, and any relevant agencies, prior to making any decisions.


