Description
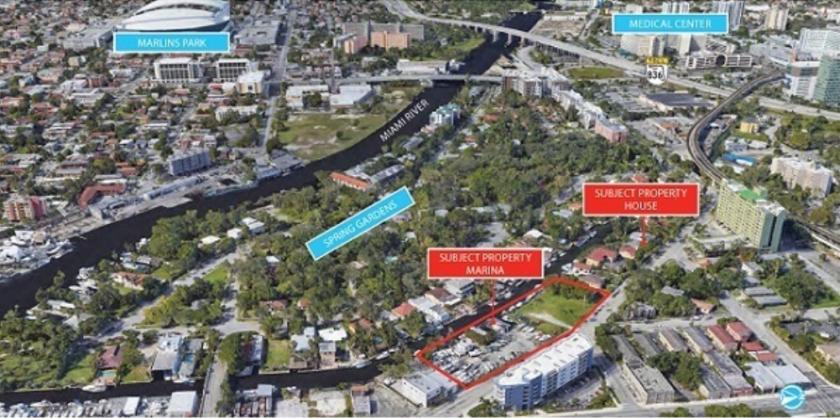
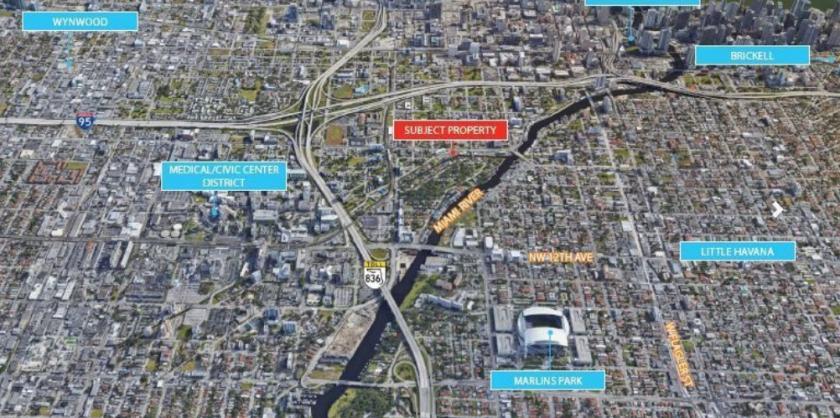
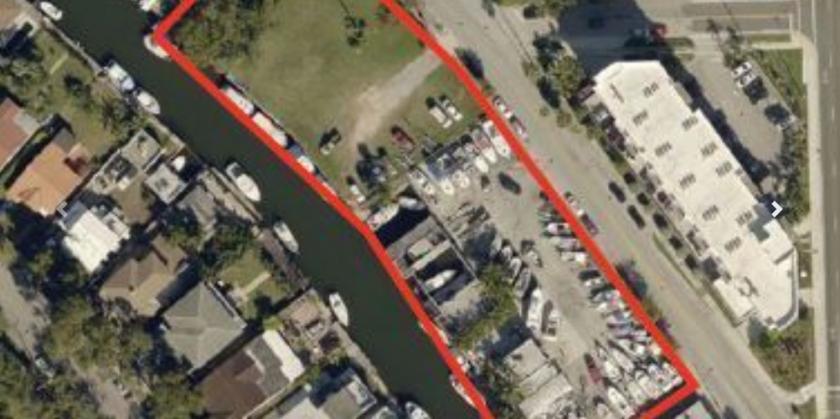
Avison Young is the exclusive agent for the marketing and sale of the Rivers Edge Development Site (“the Property”), six contiguous waterfront parcels plus a single-family house. A total land area of 59,088 square feet located midway between Downtown Miami and the Medical/Civic Center District in Miami, Florida.
Highlights
EMPLOYMENT HUBS – Minutes from major employment hubs such as Medical/Civic Center District (courts and hospitals, over 40,000 employees), and Downtown Miami (11,000 businesses, over 176,000 employees).
WATERFRONT LIVING/LOW DENSITY – Strong demand for luxury waterfront townhome or mid-rise living near Miami’s urban core with a low-density designation of only 65 units per acre.
MASS TRANSIT – Property is walking distance (two blocks) from the Culmer MetroRail Station with Civic/Medical Center District one stop west, and Downtown Government Center two stops east.
HISTORIC DESIGNATION – The Spring Gardens historic designation west of the Property will preserve westerly views of the lush neighborhood.
DEVELOPMENT POTENTIAL – Under Miami 21 zoning, the Property may be developed as a mid-rise, five-story multifamily building. Up to 88 residential units may be allowed per total acreage.
No part of this information may be copied, reproduced, repurposed, or screen-captured for any commercial purpose without prior written authorization from MyEListing.
While we strive to provide the most accurate information, all listing information, and demographic data, is provided by third-parties. As such, MyEListing will not be responsible for the accuracy of the information. It is strongly recommended that you verify all information with the listing agent, and any relevant agencies, prior to making any decisions.
How much land does the Miami, FL property at 810 Northwest 8th Street Road include?
810 Northwest 8th Street Road in Miami includes 1.360 acres of land
What kind of Land is the propery at 810 Northwest 8th Street Road?
The property at 810 Northwest 8th Street Road Miami, FL 33136 is listed as a Mixed Use Land Land property
What is the population within 1 mile of 810 Northwest 8th Street Road in Miami?
The population within 1 mile of 810 Northwest 8th Street Road Miami, FL 33136 is 49,446 people.
Who do I contact for questions about 810 Northwest 8th Street Road?
You should contact the listing agent,
Rosendo Caveiro, for any details regarding this commercial listing.