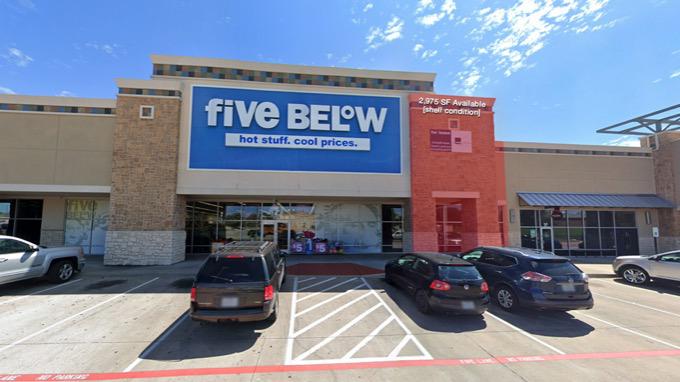
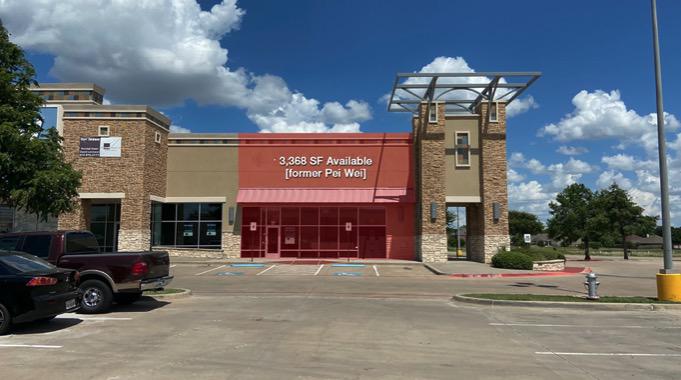
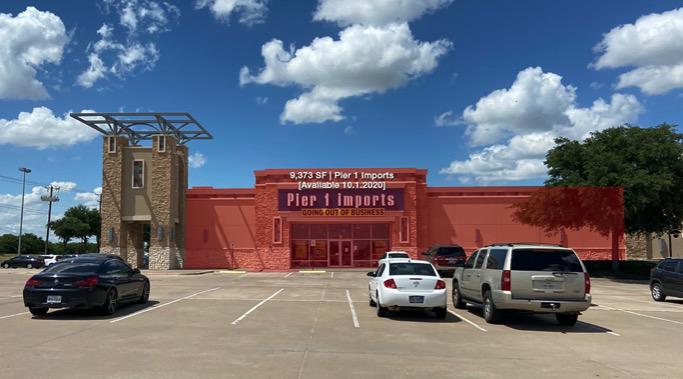
1-Mile | 3-Miles | 5-Miles | ||
---|---|---|---|---|
Total Population | 18,377 | 139,499 | 298,256 | |
Population Median Age | 34 | 34 | 35 | |
Population by Age | 0-9 Yrs | 2912 (15%) | 21478 (15%) | 44595 (14%) |
10-19 Yrs | 3323 (18%) | 21908 (15%) | 45490 (15%) | |
20-29 Yrs | 1946 (10%) | 18595 (13%) | 39210 (13%) | |
30-39 Yrs | 2782 (15%) | 20499 (14%) | 43907 (14%) | |
40-49 Yrs | 2364 (12%) | 20133 (14%) | 42461 (14%) | |
50-59 Yrs | 2751 (14%) | 18620 (13%) | 38858 (13%) | |
60-69 Yrs | 1313 (7%) | 10975 (7%) | 25050 (8%) | |
70+ Yrs | 986 (5%) | 7291 (5%) | 18684 (6%) | |
Median HH Income | $85,346 | $82,177 | $80,983 | |
Total Household Income | < 24K | 489 (8%) | 3635 (7%) | 9287 (9%) |
25-49K | 750 (13%) | 7654 (16%) | 17852 (17%) | |
50-74K | 1087 (19%) | 9277 (20%) | 19677 (19%) | |
75-99K | 999 (18%) | 7629 (16%) | 15153 (15%) | |
100-199K | 1899 (34%) | 14622 (32%) | 30394 (30%) | |
200K+ | 256 (4%) | 2697 (5%) | 8523 (8%) | |
Highest Education Level | No Diploma | 898 | 7268 | 15830 |
Diploma or GED | 2716 | 19805 | 40986 | |
Some College | 3354 | 22853 | 46668 | |
Assoc. Degree | 911 | 7431 | 17266 | |
Bachelors Degree | 2404 | 21815 | 49535 | |
Higher Degree | 951 | 8090 | 19563 | |
Total Housing Units | 5,647 | 47,228 | 105,623 | |
--Owner-Occupied | 4,408 | 33,844 | 69,836 | |
--Renter-Occupied | 1,071 | 11,670 | 31,051 | |
Owner-Occupied Values | < 100K | 365 | 4084 | 8350 |
100-199K | 2785 | 16599 | 29103 | |
200-299K | 1071 | 8293 | 17944 | |
300-399K | 133 | 3231 | 8062 | |
400-499K | 15 | 1222 | 3764 | |
500K+ | 39 | 415 | 2614 | |
Total Working Age Population | 13,552 | 104,232 | 224,270 | |
In Work Force | 9,716 | 76,662 | 162,511 | |
Not In Work Force | 3,836 | 27,569 | 61,759 | |
Workforce Employed | 9,088 | 73,067 | 154,749 | |
Workforce Unemployed | 611 | 3,537 | 7,455 | |
Civlian Workforce | 9,700 | 76,604 | 162,204 | |
Military Workforce | 16 | 58 | 307 | |
Total Households | 5,479 | 45,514 | 100,887 | |
Family Households | 4,828 | 35,459 | 75,610 | |
Non-Family Households | 651 | 10,055 | 25,276 | |
Married Couple | 3,774 | 27,004 | 57,789 | |
Other Family | 1,054 | 8,455 | 17,821 | |
Married w/Child | 1,874 | 13,551 | 28,478 | |
Single Male w/Child | 118 | 894 | 2,631 | |
Single Female w/Child | 487 | 3,690 | 7,757 |
Population Change Last Two Decades - Plus Projection
2000 | % | 2010 | % | 2020 | % | 2030 | |
---|---|---|---|---|---|---|---|
Texas | 20,851,820 | +21 | 25,145,561 | +18 | 29,677,668 | +18 | 34,894,452 |
Tarrant County | 1,446,219 | +25 | 1,809,034 | +19 | 2,143,755 | +17 | 2,507,170 |
Total Working Age Population:
Total Households:
Total Working Age Population:
Total Households:
Total Working Age Population:
Total Households: