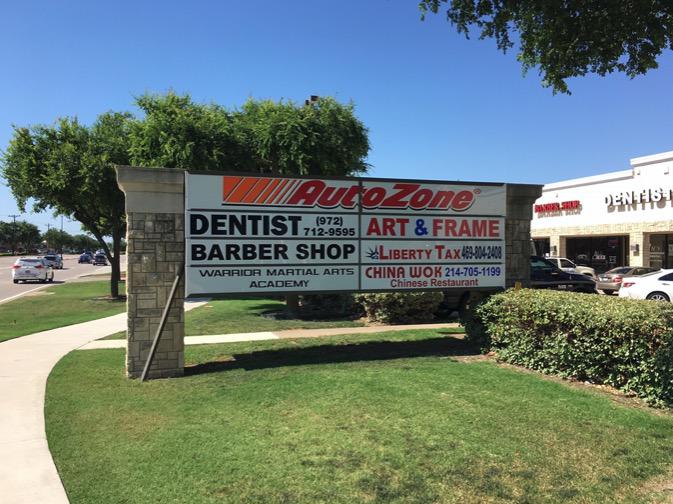
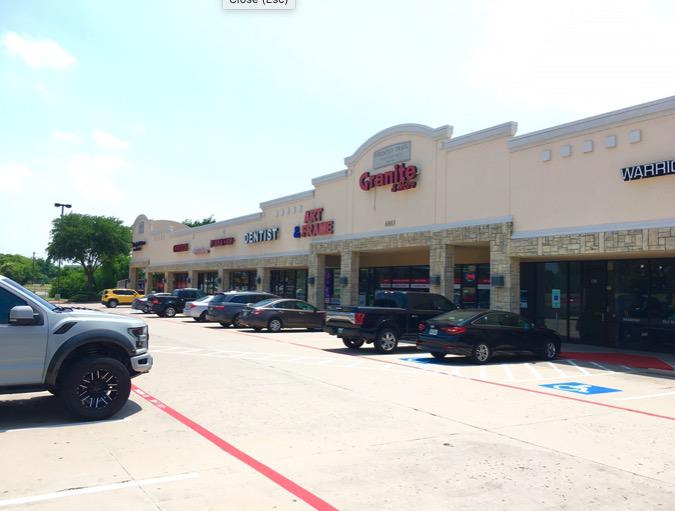
1-Mile | 3-Miles | 5-Miles | ||
---|---|---|---|---|
Total Population | 14,163 | 79,699 | 240,164 | |
Population Median Age | 36 | 35 | 34 | |
Population by Age | 0-9 Yrs | 1638 (11%) | 10729 (13%) | 34791 (14%) |
10-19 Yrs | 2031 (14%) | 13401 (16%) | 41059 (17%) | |
20-29 Yrs | 2274 (16%) | 8505 (10%) | 22684 (9%) | |
30-39 Yrs | 2148 (15%) | 11821 (14%) | 35735 (14%) | |
40-49 Yrs | 2258 (15%) | 16211 (20%) | 49478 (20%) | |
50-59 Yrs | 1853 (13%) | 9966 (12%) | 30009 (12%) | |
60-69 Yrs | 1214 (8%) | 5484 (6%) | 15914 (6%) | |
70+ Yrs | 747 (5%) | 3582 (4%) | 10495 (4%) | |
Median HH Income | $73,192 | $104,399 | $116,549 | |
Total Household Income | < 24K | 653 (11%) | 2557 (8%) | 5732 (6%) |
25-49K | 1320 (23%) | 3846 (13%) | 8870 (10%) | |
50-74K | 954 (16%) | 3774 (12%) | 10801 (12%) | |
75-99K | 773 (13%) | 3859 (13%) | 10115 (12%) | |
100-199K | 1592 (27%) | 10102 (34%) | 31348 (37%) | |
200K+ | 442 (7%) | 5043 (17%) | 17236 (20%) | |
Highest Education Level | No Diploma | 716 | 2454 | 5705 |
Diploma or GED | 1318 | 5130 | 14094 | |
Some College | 2024 | 9454 | 24744 | |
Assoc. Degree | 854 | 3654 | 9951 | |
Bachelors Degree | 3094 | 19432 | 59645 | |
Higher Degree | 1361 | 11162 | 39404 | |
Total Housing Units | 6,428 | 31,346 | 89,170 | |
--Owner-Occupied | 2,648 | 17,832 | 55,822 | |
--Renter-Occupied | 3,084 | 11,349 | 28,279 | |
Owner-Occupied Values | < 100K | 107 | 446 | 972 |
100-199K | 563 | 2393 | 5258 | |
200-299K | 1108 | 5872 | 13830 | |
300-399K | 488 | 3894 | 14921 | |
400-499K | 66 | 2194 | 10414 | |
500K+ | 316 | 3033 | 10427 | |
Total Working Age Population | 11,252 | 59,918 | 176,996 | |
In Work Force | 8,373 | 44,186 | 129,598 | |
Not In Work Force | 2,879 | 15,732 | 47,398 | |
Workforce Employed | 7,835 | 42,176 | 124,622 | |
Workforce Unemployed | 465 | 1,816 | 4,734 | |
Civlian Workforce | 8,300 | 43,992 | 129,356 | |
Military Workforce | 72 | 194 | 242 | |
Total Households | 5,733 | 29,181 | 84,101 | |
Family Households | 3,647 | 20,903 | 63,699 | |
Non-Family Households | 2,086 | 8,279 | 20,402 | |
Married Couple | 2,627 | 17,298 | 54,460 | |
Other Family | 1,019 | 3,605 | 9,239 | |
Married w/Child | 1,363 | 10,514 | 34,389 | |
Single Male w/Child | 129 | 695 | 1,568 | |
Single Female w/Child | 551 | 1,631 | 4,344 |
Population Change Last Two Decades - Plus Projection
2000 | % | 2010 | % | 2020 | % | 2030 | |
---|---|---|---|---|---|---|---|
Texas | 20,851,820 | +21 | 25,145,561 | +18 | 29,677,668 | +18 | 34,894,452 |
Collin County | 491,675 | +59 | 782,341 | +33 | 1,039,369 | +34 | 1,391,461 |
Denton County | 432,976 | +53 | 662,614 | +36 | 897,953 | +37 | 1,234,110 |
Total Working Age Population:
Total Households:
Total Working Age Population:
Total Households:
Total Working Age Population:
Total Households: