Industrial Properties
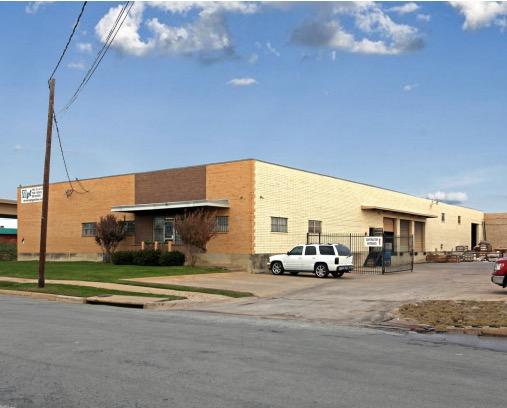
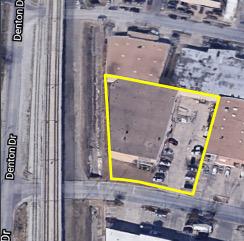
2819 Blystone Ln Dallas, TX 75220
2819 Blystone Ln Dallas, TX 75220
Details & Description
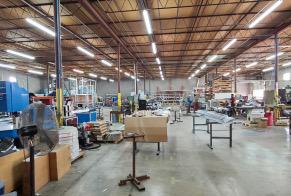
Additional Photos

Listing Agents

Keenan Cook
M: 214-814-5876
kcook@mercer-company.com
M: 214-814-5876
kcook@mercer-company.com
While we strive to provide the most accurate information, all listing information, and demographic data, is provided by third-parties. As such, MyEListing will not be responsible for the accuracy of the information. It is strongly recommended that you verify all information with the listing agent, and any relevant agencies, prior to making any decisions.


