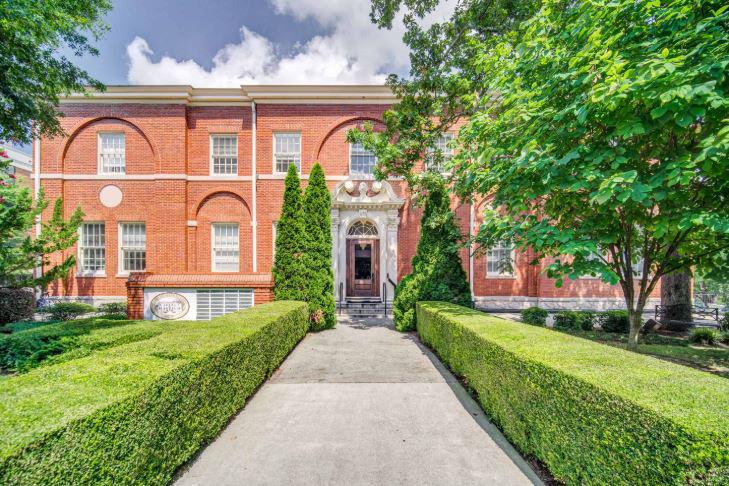
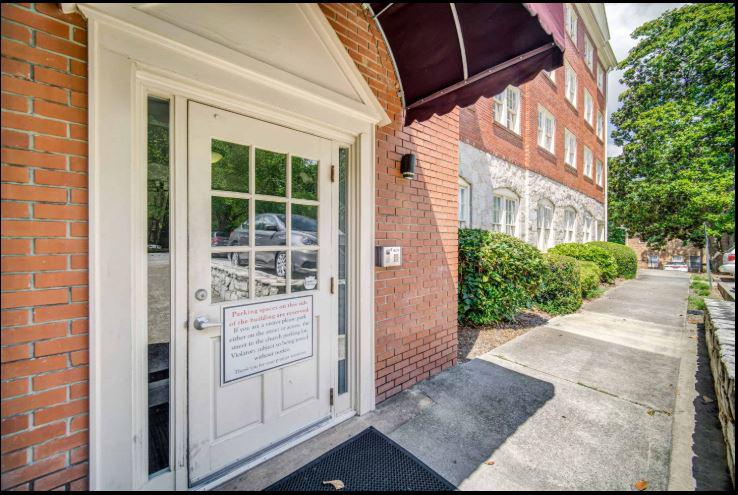
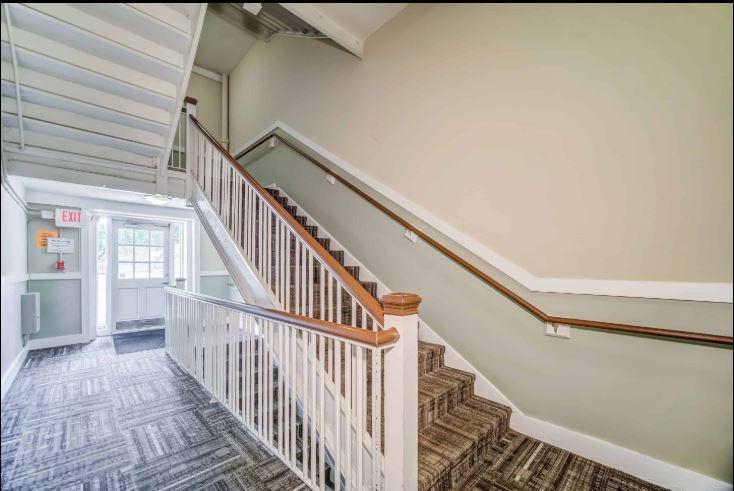
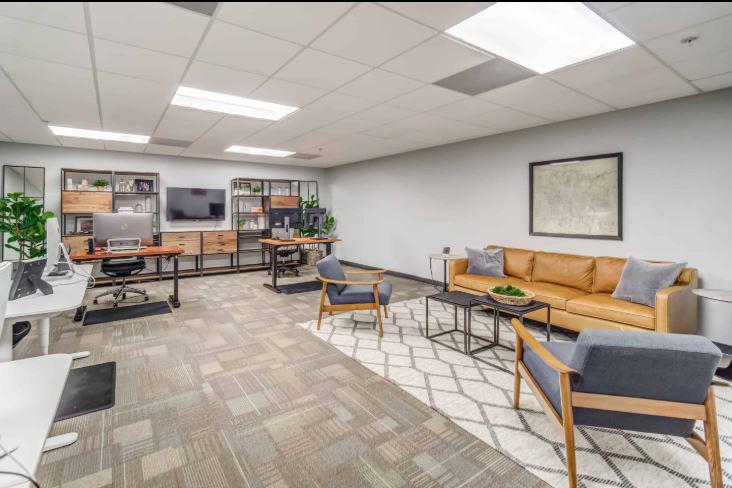
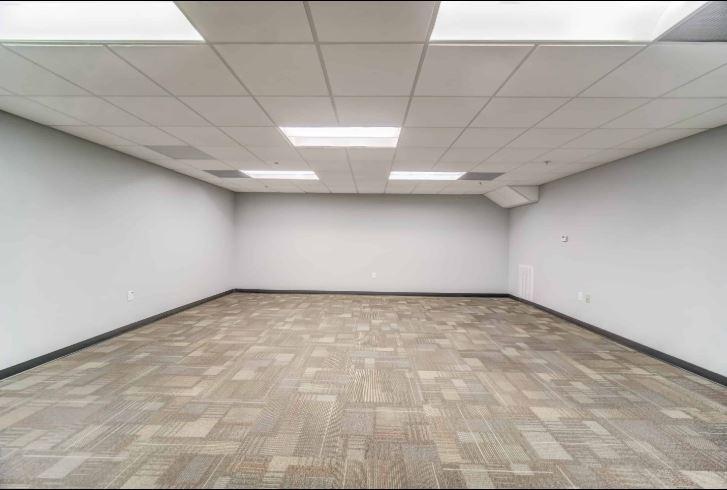
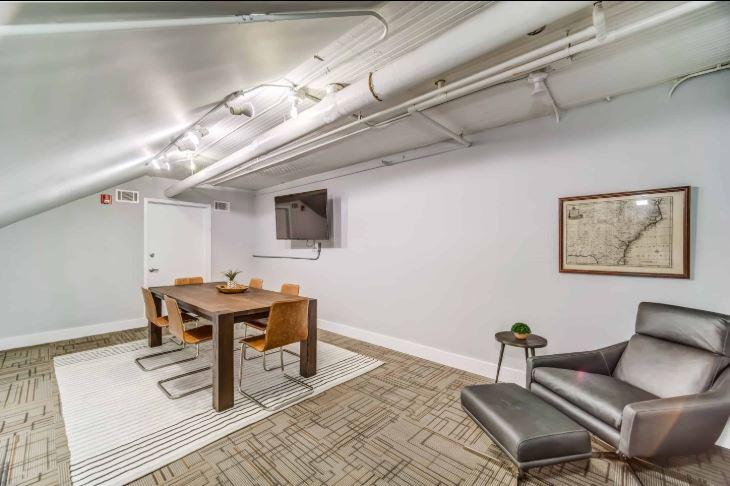
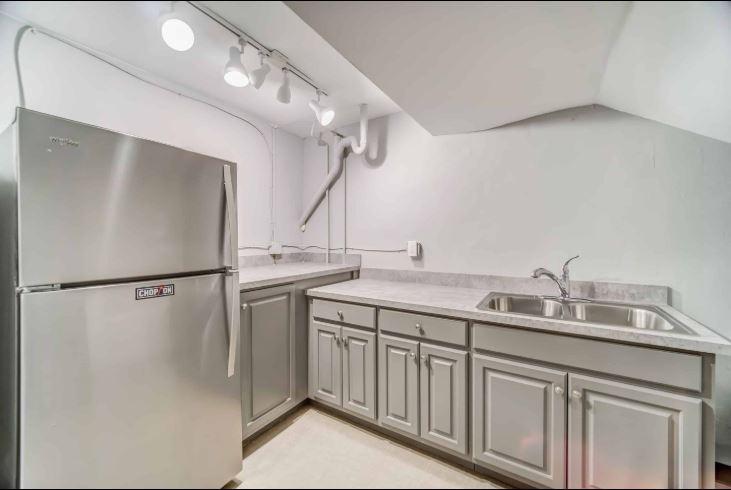
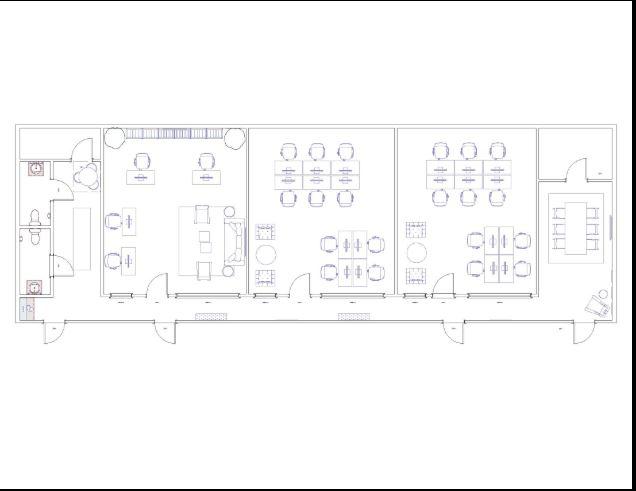
1-Mile | 3-Miles | 5-Miles | ||
---|---|---|---|---|
Total Population | 20,368 | 163,640 | 375,872 | |
Population Median Age | 36 | 35 | 36 | |
Population by Age | 0-9 Yrs | 1887 (9%) | 14131 (8%) | 38491 (10%) |
10-19 Yrs | 1706 (8%) | 17588 (10%) | 38950 (10%) | |
20-29 Yrs | 4252 (20%) | 40032 (24%) | 87502 (23%) | |
30-39 Yrs | 4740 (23%) | 32086 (19%) | 70559 (18%) | |
40-49 Yrs | 3211 (15%) | 21669 (13%) | 47935 (12%) | |
50-59 Yrs | 2179 (10%) | 17231 (10%) | 39166 (10%) | |
60-69 Yrs | 1500 (7%) | 11880 (7%) | 29040 (7%) | |
70+ Yrs | 893 (4%) | 9023 (5%) | 24229 (6%) | |
Median HH Income | $86,844 | $78,681 | $66,369 | |
Total Household Income | < 24K | 1314 (12%) | 13007 (18%) | 34161 (21%) |
25-49K | 1522 (14%) | 11243 (15%) | 28936 (17%) | |
50-74K | 1648 (16%) | 10542 (14%) | 25367 (15%) | |
75-99K | 1382 (13%) | 8374 (11%) | 17763 (11%) | |
100-199K | 2528 (24%) | 17994 (24%) | 34838 (21%) | |
200K+ | 1884 (18%) | 10891 (15%) | 19887 (12%) | |
Highest Education Level | No Diploma | 327 | 5605 | 20142 |
Diploma or GED | 1150 | 12067 | 37377 | |
Some College | 1511 | 13333 | 35035 | |
Assoc. Degree | 459 | 4386 | 10595 | |
Bachelors Degree | 6448 | 39100 | 82131 | |
Higher Degree | 5864 | 37608 | 71239 | |
Total Housing Units | 11,509 | 83,261 | 189,529 | |
--Owner-Occupied | 4,762 | 34,431 | 72,055 | |
--Renter-Occupied | 5,517 | 37,621 | 88,896 | |
Owner-Occupied Values | < 100K | 86 | 1341 | 5851 |
100-199K | 707 | 5410 | 13108 | |
200-299K | 557 | 6611 | 14559 | |
300-399K | 532 | 5968 | 11537 | |
400-499K | 441 | 3748 | 7505 | |
500K+ | 2439 | 11354 | 19496 | |
Total Working Age Population | 17,398 | 142,936 | 320,625 | |
In Work Force | 14,228 | 101,552 | 220,294 | |
Not In Work Force | 3,170 | 41,384 | 100,331 | |
Workforce Employed | 13,924 | 96,697 | 207,882 | |
Workforce Unemployed | 300 | 4,765 | 12,193 | |
Civlian Workforce | 14,224 | 101,462 | 220,075 | |
Military Workforce | 5 | 90 | 220 | |
Total Households | 10,279 | 72,052 | 160,952 | |
Family Households | 3,847 | 26,795 | 63,034 | |
Non-Family Households | 6,432 | 45,257 | 97,917 | |
Married Couple | 3,089 | 20,566 | 43,238 | |
Other Family | 758 | 6,230 | 19,796 | |
Married w/Child | 1,237 | 7,915 | 17,432 | |
Single Male w/Child | 173 | 684 | 1,809 | |
Single Female w/Child | 330 | 2,716 | 8,514 |
Population Change Last Two Decades - Plus Projection
2000 | % | 2010 | % | 2020 | % | 2030 | |
---|---|---|---|---|---|---|---|
Georgia | 8,186,453 | +18 | 9,687,653 | +10 | 10,694,980 | +9 | 11,709,700 |
Fulton County | 816,006 | +13 | 920,581 | +17 | 1,074,154 | +11 | 1,186,980 |
DeKalb County | 665,865 | +4 | 691,893 | +11 | 770,294 | +7 | 822,063 |
Total Working Age Population:
Total Households:
Total Working Age Population:
Total Households:
Total Working Age Population:
Total Households: