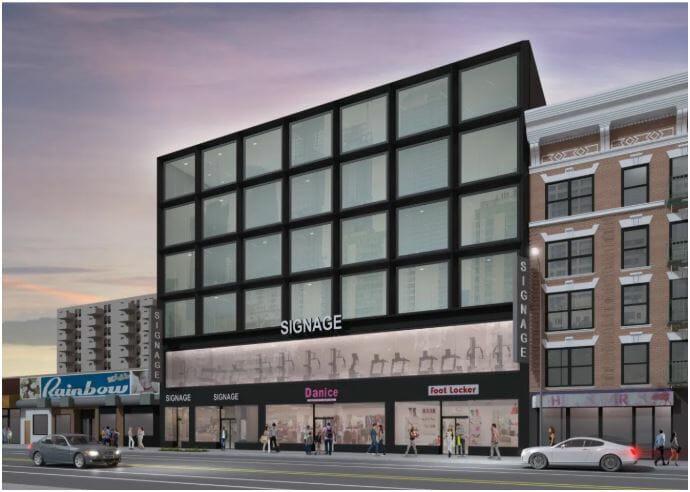
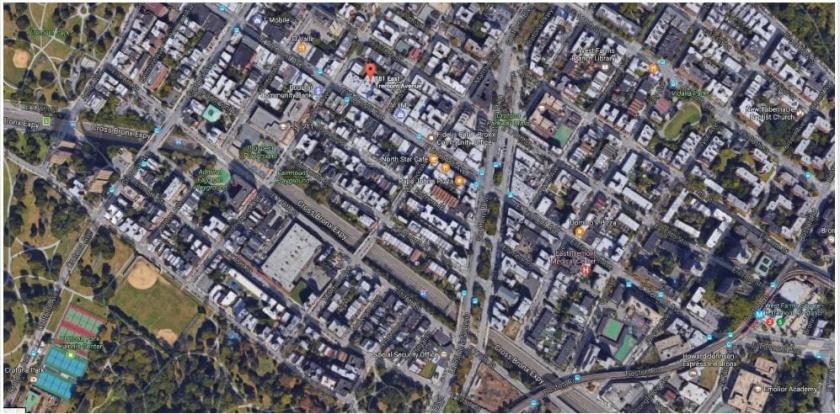
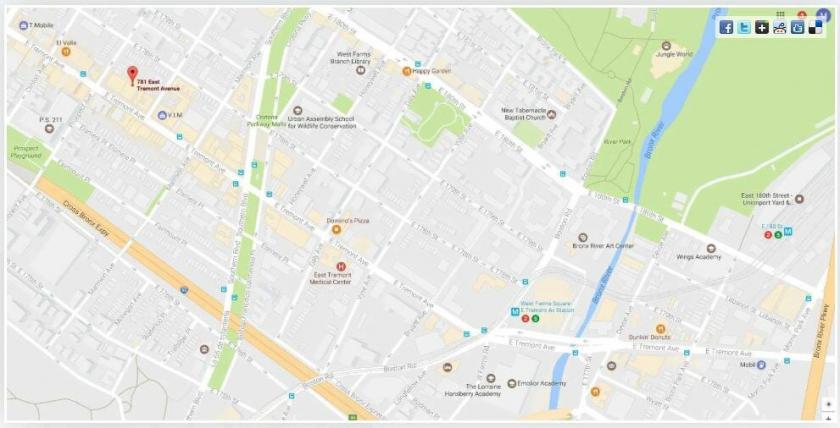
Leasing Details:Asking Price Per Square Foot$35.00Size Available58,940 SFMinimum Divisible500 SFTotal Building SF72,000 SFLease TypeNNN DetailsHighlights:Neighborhood Features High population density neighborhood with nearly 1,200,000 people and 1,000,000 housing units within a 5-mile radius East Tremont Avenue provides good exposure on both foot and car traffic Surrounded by mid and high-rise apartment complexes Multiple schools surround the property such as: P.S. 55 Benjamin Franklin, P.S. 42, P.S 63 Author’s Academy, IS 219 New Venture School Bronx Center for Science and Mathematics Bronx Early College Academy Icahn Charter School Frederick Douglass Academy III Multiple Medical Centers surround the property such as: Triboro Center Montefiore Hospital Bronx Lebanon Special Care & Hospital Center Morrisania Health Center Boston Road Medical Center Fulton Family Medicine Center MLK Health Center Surrounded by national and regional tenants due to East Tremont’s good retail corridorBuilding Features Currently an existing retail taxpayer to be developed to a multi-level commercial building totaling roughly 72,000 SF Built-to-suit opportunity with Foot Locker and Danice as Anchor Tenants Good frontage exposure of 86 feet on East Tremont Avenue Floors Two to Five Retail/Office Availability of 12,500 SF Per Floor Plate Floor Six Retail/Office Availability of 8,940 SF 12 Feet Ceiling Heights on all Floors Light & Air in Front & Back of the Building ICAP Tax Abatement will be Secured Delivery Date is estimated to be Spring of 2021Transportation Several blocks away from the East Tremont Ave Station that has the Subway Lines 4 & 5 going straight into Manhattan and the Harlem Rail Line on East Tremont Multiple Bus Lines that stop and surround at 775 East Tremont Ave Near the Cross Bronx Expressway and the Bronx River Parkway