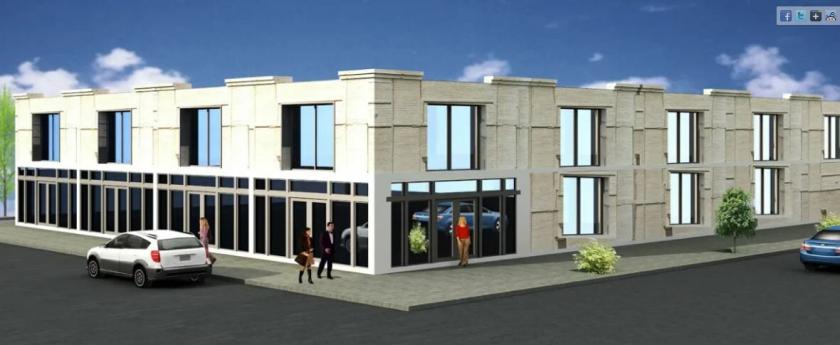
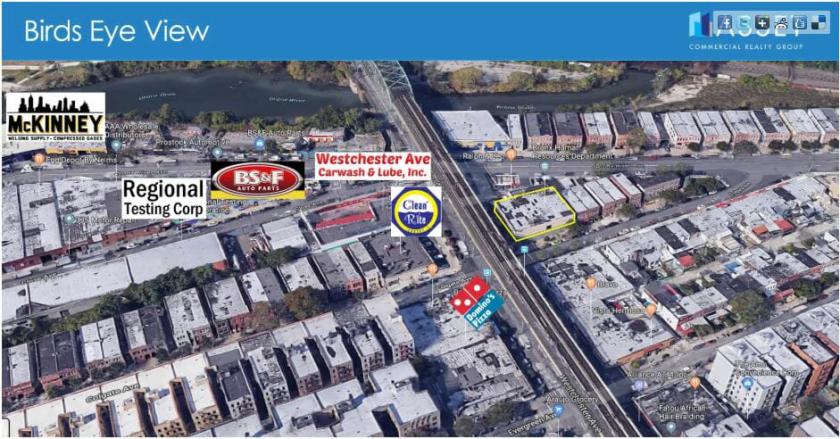
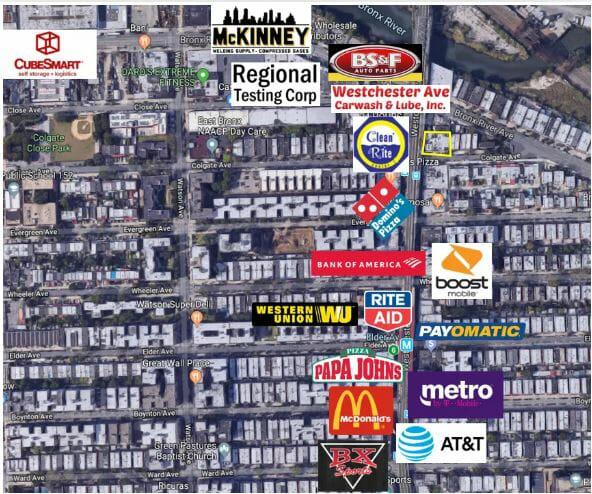
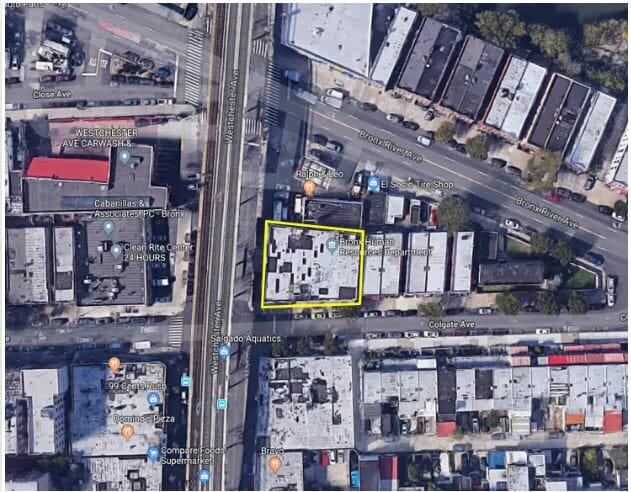
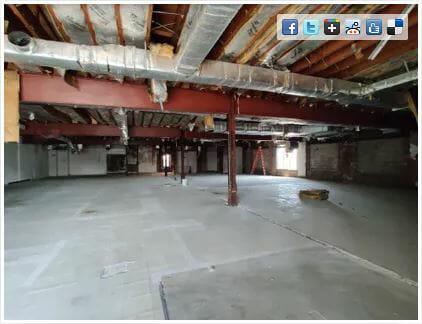
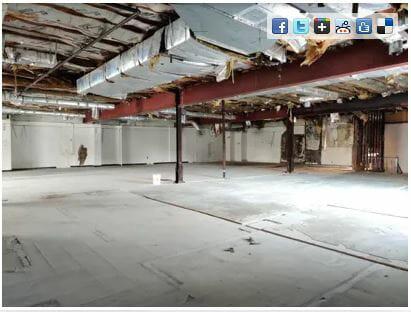
1-Mile | 3-Miles | 5-Miles | ||
---|---|---|---|---|
Total Population | 146,362 | 1,064,775 | 2,310,585 | |
Population Median Age | 35 | 35 | 37 | |
Population by Age | 0-9 Yrs | 22715 (15%) | 159959 (15%) | 294638 (12%) |
10-19 Yrs | 20989 (14%) | 151232 (14%) | 279676 (12%) | |
20-29 Yrs | 24624 (16%) | 182610 (17%) | 401890 (17%) | |
30-39 Yrs | 21274 (14%) | 152495 (14%) | 351512 (15%) | |
40-49 Yrs | 16751 (11%) | 129316 (12%) | 287999 (12%) | |
50-59 Yrs | 16910 (11%) | 128679 (12%) | 283290 (12%) | |
60-69 Yrs | 12052 (8%) | 84804 (7%) | 211194 (9%) | |
70+ Yrs | 11048 (7%) | 75681 (7%) | 200385 (8%) | |
Median HH Income | $29,195 | $32,740 | $43,564 | |
Total Household Income | < 24K | 22151 (44%) | 150662 (41%) | 276458 (32%) |
25-49K | 12702 (25%) | 88508 (24%) | 180728 (21%) | |
50-74K | 6725 (13%) | 54266 (14%) | 128745 (15%) | |
75-99K | 3725 (7%) | 30458 (8%) | 83991 (10%) | |
100-199K | 3802 (7%) | 33943 (9%) | 127109 (15%) | |
200K+ | 623 (1%) | 5636 (1%) | 41043 (4%) | |
Highest Education Level | No Diploma | 32531 | 213717 | 389127 |
Diploma or GED | 24860 | 184309 | 385457 | |
Some College | 16076 | 115231 | 239257 | |
Assoc. Degree | 6047 | 46479 | 103499 | |
Bachelors Degree | 9021 | 73381 | 262516 | |
Higher Degree | 2481 | 32678 | 175734 | |
Total Housing Units | 53,389 | 383,244 | 901,704 | |
--Owner-Occupied | 5,712 | 42,824 | 160,860 | |
--Renter-Occupied | 44,016 | 320,650 | 677,214 | |
Owner-Occupied Values | < 100K | 884 | 5835 | 18712 |
100-199K | 283 | 4862 | 12138 | |
200-299K | 479 | 3928 | 14473 | |
300-399K | 1066 | 7418 | 22687 | |
400-499K | 1476 | 10102 | 25958 | |
500K+ | 1524 | 10679 | 66892 | |
Total Working Age Population | 110,755 | 814,712 | 1,850,859 | |
In Work Force | 62,544 | 477,524 | 1,131,312 | |
Not In Work Force | 48,212 | 337,188 | 719,547 | |
Workforce Employed | 55,649 | 422,307 | 1,025,244 | |
Workforce Unemployed | 6,821 | 54,967 | 105,579 | |
Civlian Workforce | 62,470 | 477,274 | 1,130,823 | |
Military Workforce | 74 | 250 | 489 | |
Total Households | 49,728 | 363,474 | 838,074 | |
Family Households | 33,627 | 239,215 | 508,040 | |
Non-Family Households | 16,100 | 124,259 | 330,034 | |
Married Couple | 12,435 | 91,701 | 238,705 | |
Other Family | 21,192 | 147,514 | 269,335 | |
Married w/Child | 5,796 | 46,117 | 105,308 | |
Single Male w/Child | 1,780 | 11,463 | 20,306 | |
Single Female w/Child | 9,795 | 64,862 | 105,387 |
Population Change Last Two Decades - Plus Projection
2000 | % | 2010 | % | 2020 | % | 2030 | |
---|---|---|---|---|---|---|---|
New York | 18,976,457 | +2 | 19,378,102 | +4 | 20,146,131 | +2 | 20,604,030 |
Queens County | 2,229,379 | 0 | 2,230,722 | +9 | 2,436,549 | +5 | 2,565,268 |
New York County | 1,537,195 | +3 | 1,585,873 | +6 | 1,688,894 | +2 | 1,727,631 |
Bronx County | 1,332,650 | +4 | 1,385,108 | +10 | 1,519,809 | +6 | 1,604,168 |
New Jersey | 8,414,350 | +4 | 8,791,894 | +4 | 9,132,700 | +4 | 9,530,900 |
Bergen County | 884,118 | +2 | 905,116 | +7 | 967,500 | +7 | 1,031,500 |
Total Working Age Population:
Total Households:
Total Working Age Population:
Total Households:
Total Working Age Population:
Total Households: