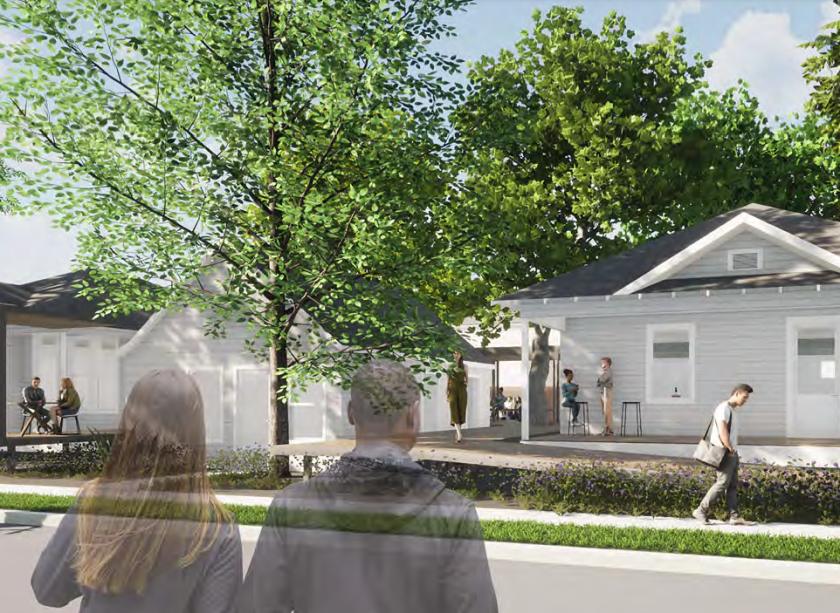
Retail Space
3415-3423 White Oak Dr Houston, TX 77007
3415-3423 White Oak Dr Houston, TX 77007
Details & Description
Property Highlights
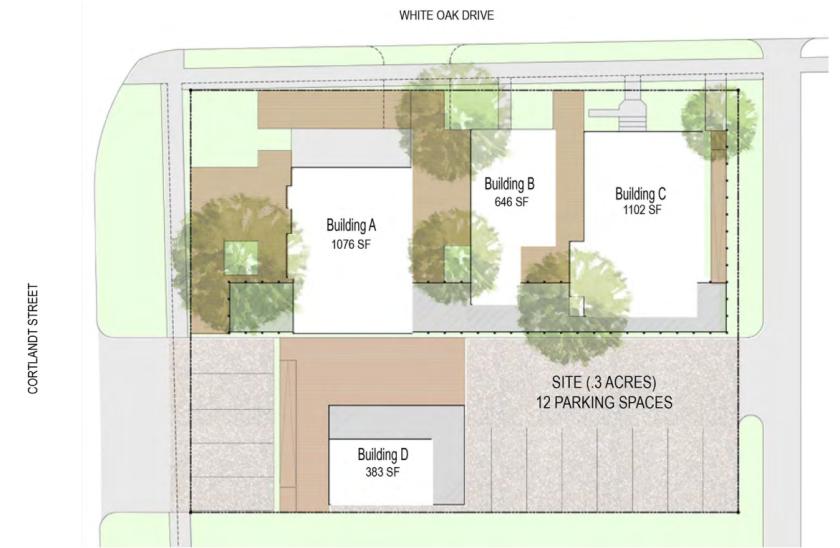
- • Bldg A - 1,076 SF
- • Bldg B - 646 SF
- • Bldg C - 1,102 SF
- • Bldg D - 383 SF
- • Excellent Restaurant and Retail Opportunities
Additional Photos


Listing Agents

Ryan Neyland
O: 281-995-2200
M: 713-398-9560
ryan@palodurocp.com
O: 281-995-2200
M: 713-398-9560
ryan@palodurocp.com
While we strive to provide the most accurate information, all listing information, and demographic data, is provided by third-parties. As such, MyEListing will not be responsible for the accuracy of the information. It is strongly recommended that you verify all information with the listing agent, and any relevant agencies, prior to making any decisions.