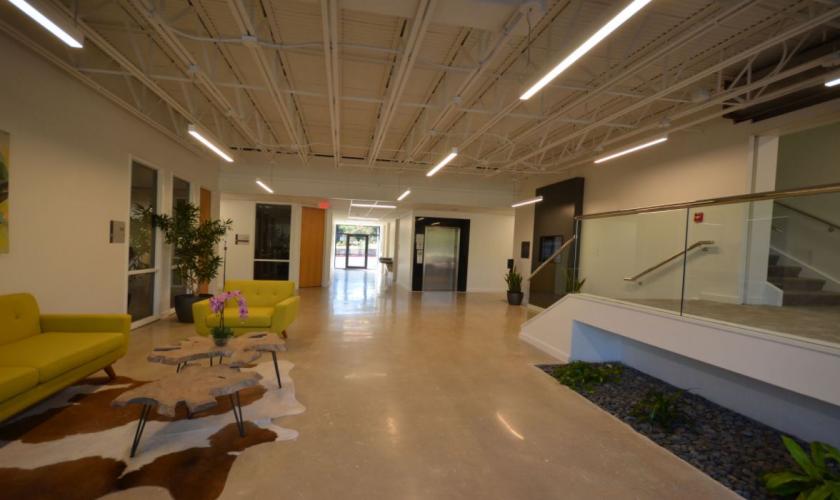
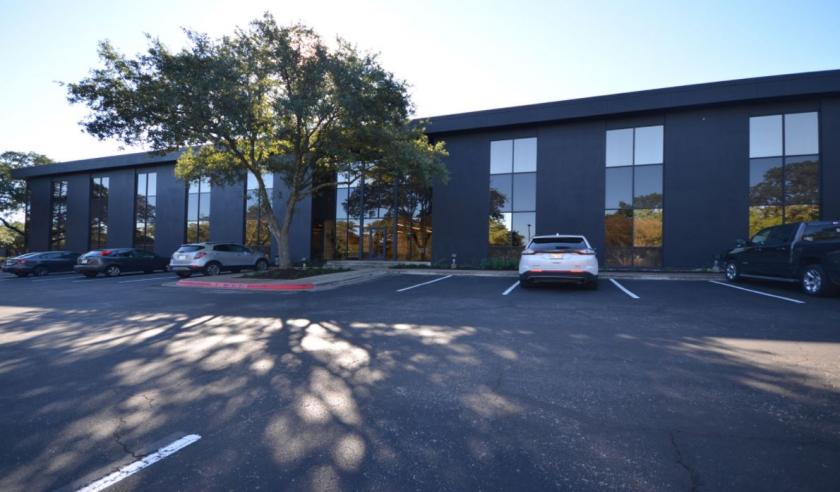
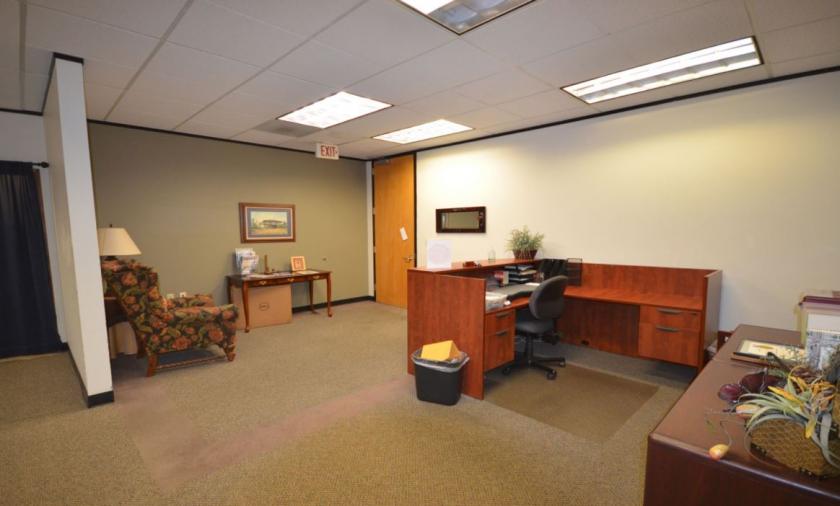
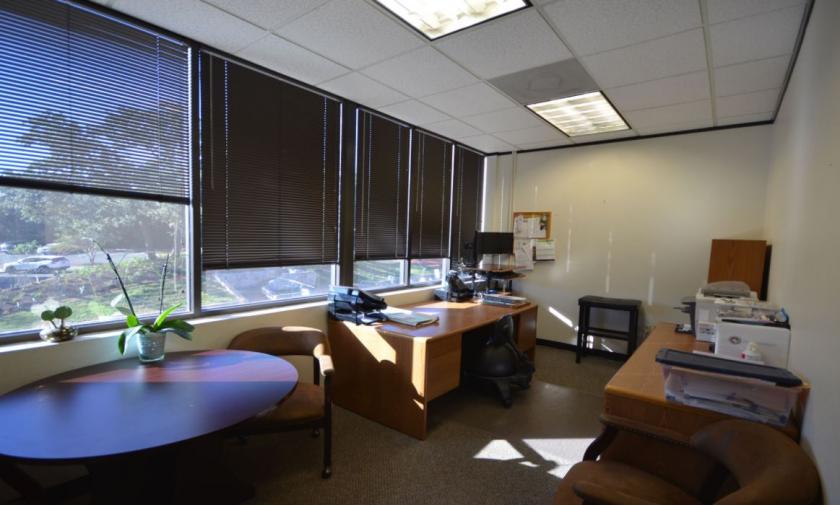
1-Mile | 3-Miles | 5-Miles | ||
---|---|---|---|---|
Total Population | 16,455 | 111,109 | 294,997 | |
Population Median Age | 39 | 37 | 36 | |
Population by Age | 0-9 Yrs | 1920 (11%) | 13182 (11%) | 35174 (11%) |
10-19 Yrs | 1180 (7%) | 10556 (9%) | 30666 (10%) | |
20-29 Yrs | 3362 (20%) | 18585 (16%) | 55765 (18%) | |
30-39 Yrs | 2994 (18%) | 21824 (19%) | 56801 (19%) | |
40-49 Yrs | 2038 (12%) | 15079 (13%) | 39394 (13%) | |
50-59 Yrs | 1521 (9%) | 12907 (11%) | 32887 (11%) | |
60-69 Yrs | 1437 (8%) | 9898 (8%) | 24594 (8%) | |
70+ Yrs | 2003 (12%) | 9078 (8%) | 19715 (6%) | |
Median HH Income | $66,922 | $74,060 | $69,047 | |
Total Household Income | < 24K | 1383 (17%) | 8028 (16%) | 20561 (16%) |
25-49K | 1715 (21%) | 9239 (18%) | 25116 (20%) | |
50-74K | 1355 (16%) | 8029 (16%) | 21076 (16%) | |
75-99K | 887 (10%) | 5610 (11%) | 13841 (11%) | |
100-199K | 1742 (21%) | 12144 (24%) | 28281 (22%) | |
200K+ | 1045 (12%) | 6983 (13%) | 15549 (12%) | |
Highest Education Level | No Diploma | 373 | 7202 | 22340 |
Diploma or GED | 1085 | 10208 | 30399 | |
Some College | 1608 | 11619 | 30523 | |
Assoc. Degree | 731 | 3648 | 10129 | |
Bachelors Degree | 4557 | 28301 | 68364 | |
Higher Degree | 4184 | 21206 | 47379 | |
Total Housing Units | 8,747 | 54,356 | 136,500 | |
--Owner-Occupied | 3,611 | 21,772 | 51,525 | |
--Renter-Occupied | 4,515 | 28,260 | 72,899 | |
Owner-Occupied Values | < 100K | 98 | 451 | 1444 |
100-199K | 297 | 1962 | 5598 | |
200-299K | 337 | 2648 | 8697 | |
300-399K | 626 | 3314 | 8329 | |
400-499K | 643 | 3784 | 7643 | |
500K+ | 1610 | 9613 | 19813 | |
Total Working Age Population | 13,721 | 91,037 | 241,297 | |
In Work Force | 9,779 | 68,352 | 177,331 | |
Not In Work Force | 3,942 | 22,685 | 63,966 | |
Workforce Employed | 9,524 | 66,322 | 170,657 | |
Workforce Unemployed | 255 | 2,017 | 6,563 | |
Civlian Workforce | 9,779 | 68,339 | 177,219 | |
Military Workforce | 0 | 13 | 112 | |
Total Households | 8,126 | 50,032 | 124,424 | |
Family Households | 3,673 | 24,227 | 61,732 | |
Non-Family Households | 4,453 | 25,805 | 62,691 | |
Married Couple | 2,866 | 18,654 | 47,423 | |
Other Family | 807 | 5,573 | 14,310 | |
Married w/Child | 1,209 | 8,470 | 22,408 | |
Single Male w/Child | 65 | 770 | 2,054 | |
Single Female w/Child | 319 | 2,316 | 5,344 |
Population Change Last Two Decades - Plus Projection
2000 | % | 2010 | % | 2020 | % | 2030 | |
---|---|---|---|---|---|---|---|
Texas | 20,851,820 | +21 | 25,145,561 | +18 | 29,677,668 | +18 | 34,894,452 |
Hays County | 97,589 | +61 | 157,107 | +50 | 234,896 | +48 | 347,120 |
Travis County | 812,280 | +26 | 1,024,266 | +26 | 1,291,502 | +19 | 1,540,812 |
Williamson County | 249,967 | +69 | 422,679 | +40 | 589,914 | +41 | 830,421 |
Total Working Age Population:
Total Households:
Total Working Age Population:
Total Households:
Total Working Age Population:
Total Households: