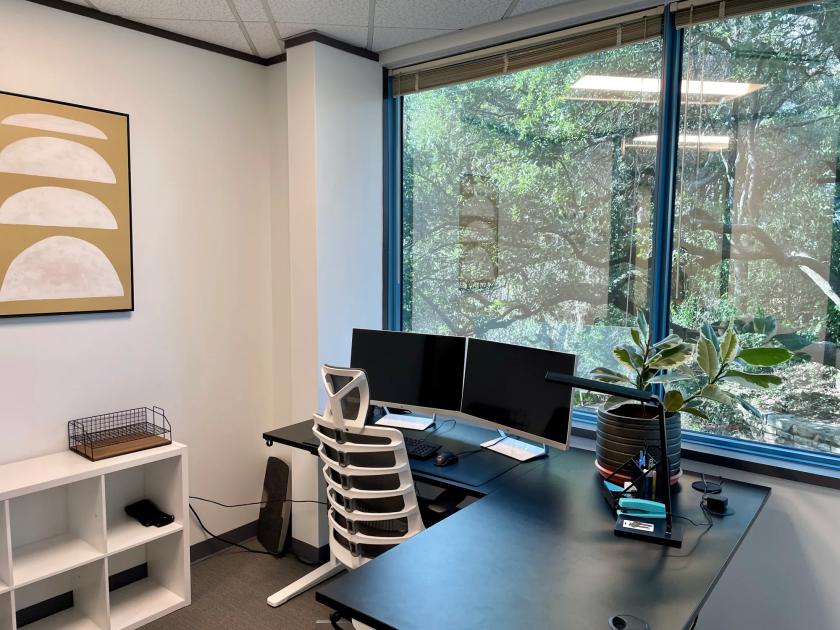
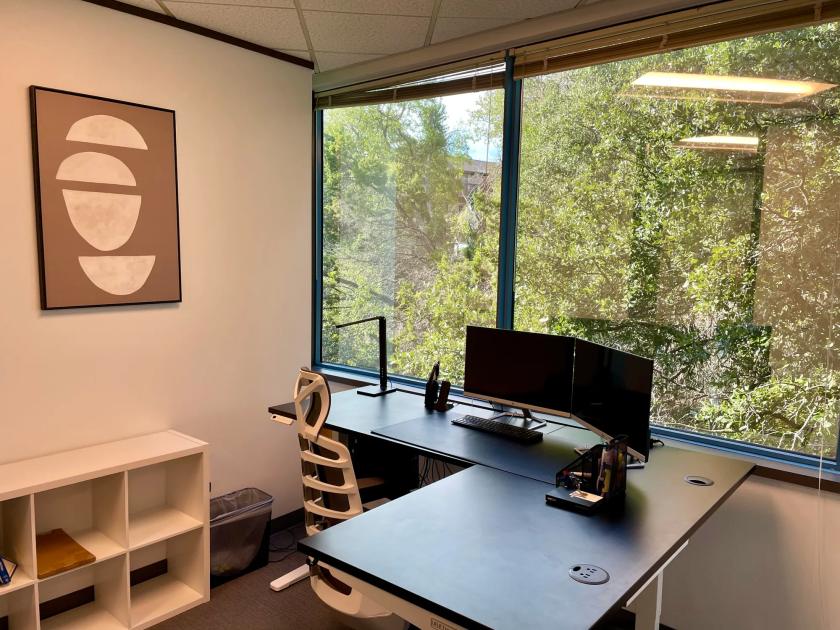
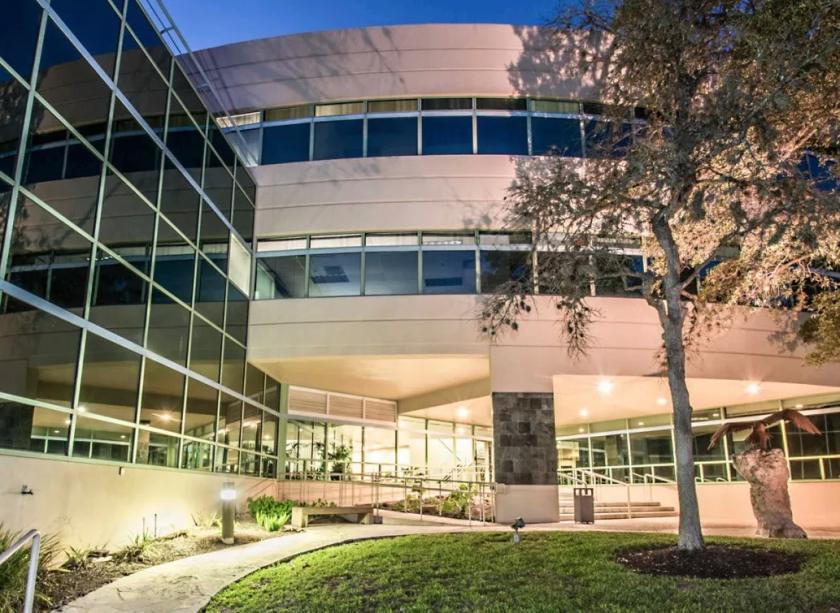
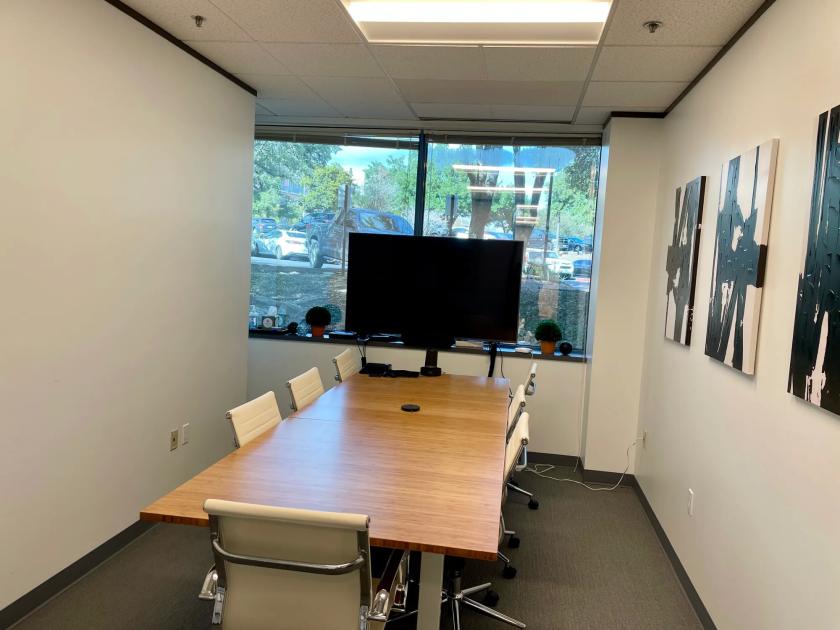
Office Space
9020 North Capital of Texas Highway Austin, TX 78759
9020 North Capital of Texas Highway Austin, TX 78759
Details & Description
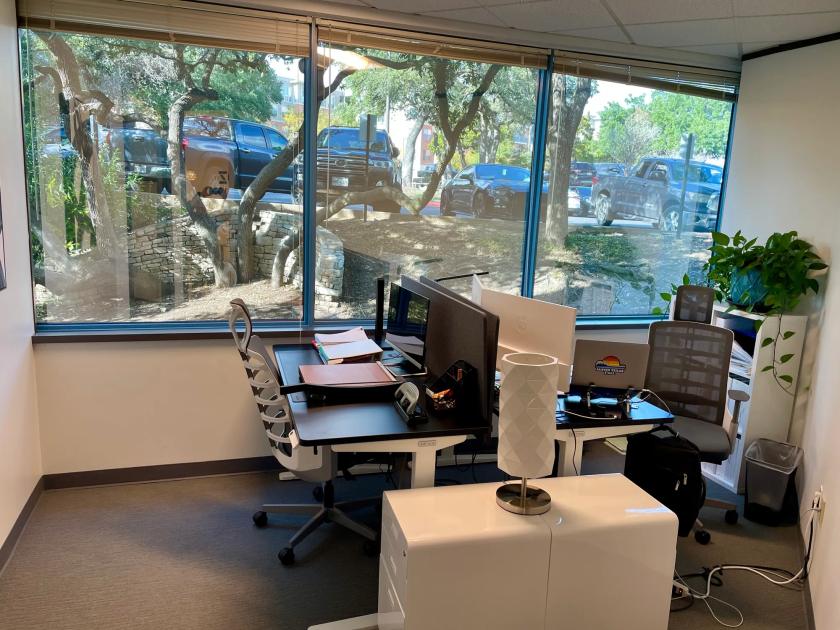
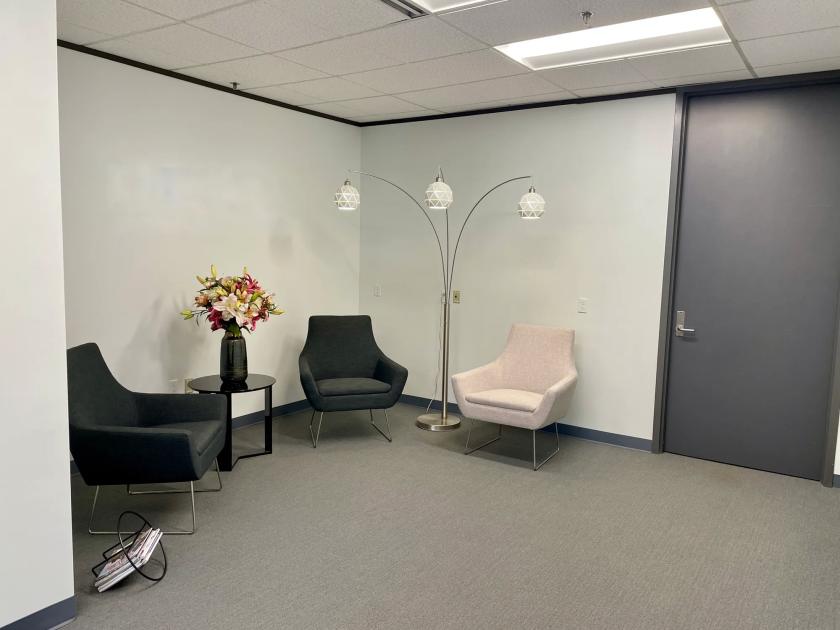
Additional Photos

Listing Agents

Andrew Creixell
O: 512-447-2222
andrew@csarealtygroup.com
O: 512-447-2222
andrew@csarealtygroup.com
While we strive to provide the most accurate information, all listing information, and demographic data, is provided by third-parties. As such, MyEListing will not be responsible for the accuracy of the information. It is strongly recommended that you verify all information with the listing agent, and any relevant agencies, prior to making any decisions.