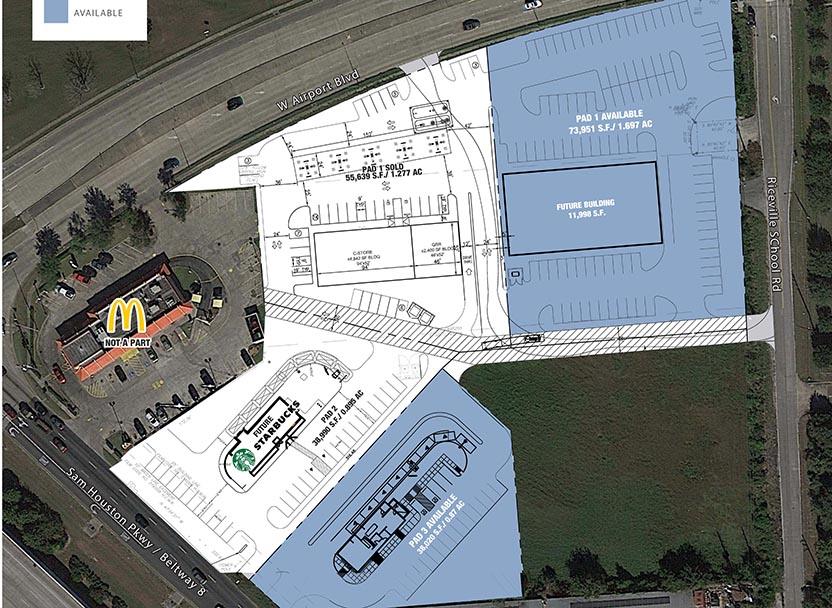
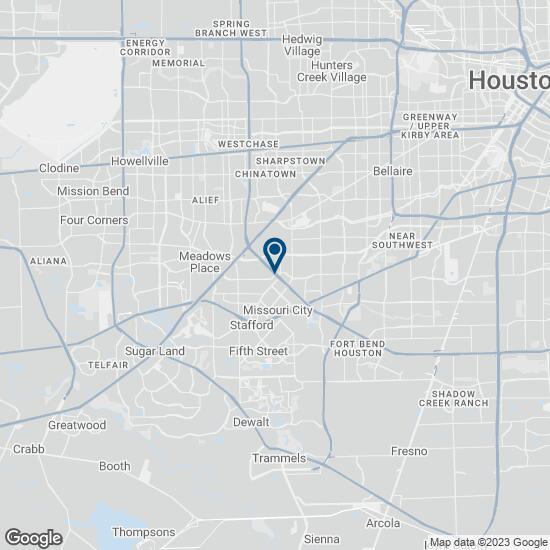
1-Mile | 3-Miles | 5-Miles | ||
---|---|---|---|---|
Total Population | 14,370 | 145,725 | 424,858 | |
Population Median Age | 39 | 35 | 35 | |
Population by Age | 0-9 Yrs | 1397 (9%) | 22508 (15%) | 62221 (14%) |
10-19 Yrs | 2145 (14%) | 20200 (13%) | 59833 (14%) | |
20-29 Yrs | 2252 (15%) | 22100 (15%) | 64443 (15%) | |
30-39 Yrs | 1520 (10%) | 21434 (14%) | 63252 (14%) | |
40-49 Yrs | 2109 (14%) | 19302 (13%) | 54580 (12%) | |
50-59 Yrs | 1604 (11%) | 17325 (11%) | 50070 (11%) | |
60-69 Yrs | 2033 (14%) | 14196 (9%) | 41093 (9%) | |
70+ Yrs | 1310 (9%) | 8659 (5%) | 29365 (6%) | |
Median HH Income | $64,539 | $43,608 | $49,725 | |
Total Household Income | < 24K | 840 (15%) | 14619 (27%) | 33707 (23%) |
25-49K | 1257 (23%) | 15584 (28%) | 39611 (27%) | |
50-74K | 996 (18%) | 9628 (17%) | 26231 (17%) | |
75-99K | 748 (14%) | 5595 (10%) | 16577 (11%) | |
100-199K | 1191 (22%) | 7114 (13%) | 23265 (15%) | |
200K+ | 259 (4%) | 1227 (2%) | 6466 (4%) | |
Highest Education Level | No Diploma | 1271 | 21010 | 62982 |
Diploma or GED | 1818 | 24899 | 68467 | |
Some College | 1758 | 17874 | 49404 | |
Assoc. Degree | 684 | 5749 | 17215 | |
Bachelors Degree | 2685 | 16157 | 49362 | |
Higher Degree | 1545 | 7415 | 23978 | |
Total Housing Units | 5,534 | 60,548 | 161,448 | |
--Owner-Occupied | 3,551 | 20,021 | 66,713 | |
--Renter-Occupied | 1,741 | 33,746 | 79,143 | |
Owner-Occupied Values | < 100K | 307 | 3558 | 11017 |
100-199K | 2261 | 10418 | 31542 | |
200-299K | 706 | 4144 | 12984 | |
300-399K | 190 | 1424 | 6463 | |
400-499K | 5 | 207 | 2219 | |
500K+ | 82 | 269 | 2489 | |
Total Working Age Population | 11,704 | 110,524 | 325,544 | |
In Work Force | 7,911 | 74,532 | 218,932 | |
Not In Work Force | 3,793 | 35,992 | 106,612 | |
Workforce Employed | 7,451 | 68,227 | 204,362 | |
Workforce Unemployed | 460 | 6,193 | 14,443 | |
Civlian Workforce | 7,911 | 74,420 | 218,805 | |
Military Workforce | 0 | 112 | 127 | |
Total Households | 5,291 | 53,766 | 145,856 | |
Family Households | 3,493 | 33,989 | 100,042 | |
Non-Family Households | 1,798 | 19,778 | 45,813 | |
Married Couple | 2,081 | 19,227 | 61,299 | |
Other Family | 1,412 | 14,762 | 38,743 | |
Married w/Child | 701 | 9,476 | 28,395 | |
Single Male w/Child | 121 | 1,651 | 4,551 | |
Single Female w/Child | 421 | 6,121 | 15,296 |
Population Change Last Two Decades - Plus Projection
2000 | % | 2010 | % | 2020 | % | 2030 | |
---|---|---|---|---|---|---|---|
Texas | 20,851,820 | +21 | 25,145,561 | +18 | 29,677,668 | +18 | 34,894,452 |
Fort Bend County | 354,452 | +65 | 585,375 | +44 | 840,383 | +43 | 1,203,029 |
Harris County | 3,400,578 | +20 | 4,092,459 | +22 | 4,978,845 | +19 | 5,924,750 |
Total Working Age Population:
Total Households:
Total Working Age Population:
Total Households:
Total Working Age Population:
Total Households: