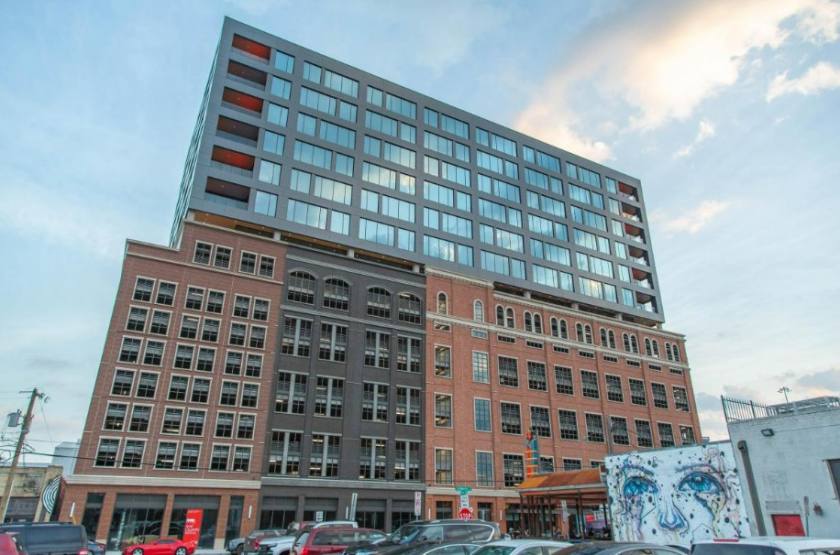
Retail Space
2700 Commerce Street Dallas, TX 75226
2700 Commerce Street Dallas, TX 75226

Details & Description
Property Highlights
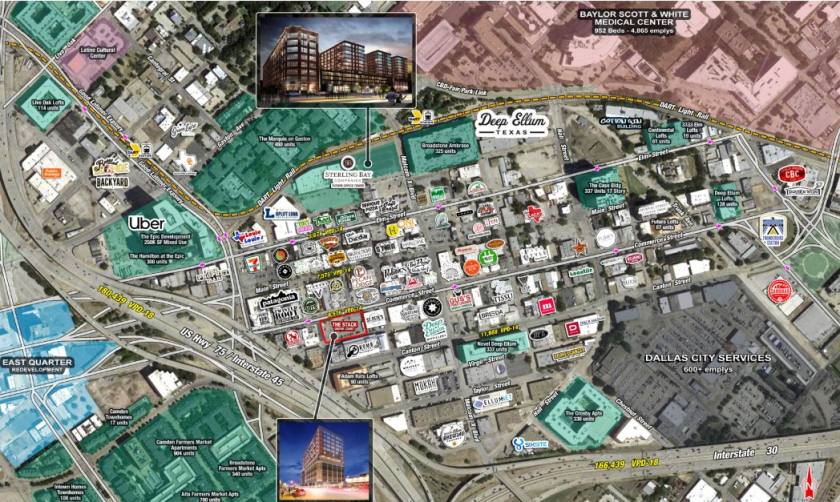
• Only vertical development in Deep Ellum with exclusive parking contained within building
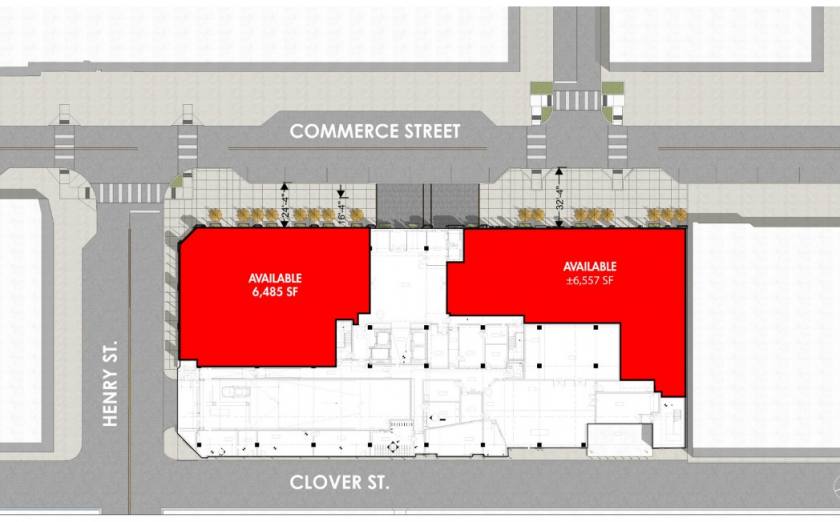
• 6,485 SF and 6,557 SF of Restaurant & Retail
Additional Photos


Listing Agents

Thomas Glendenning
O: 214-960-4528
M: 214-960-4545
thomas@shopcompanies.com
O: 214-960-4528
M: 214-960-4545
thomas@shopcompanies.com

Jake Sherrington
O: 214-960-4545
M: 214-960-4623
jake@shopcompanies.com
O: 214-960-4545
M: 214-960-4623
jake@shopcompanies.com
While we strive to provide the most accurate information, all listing information, and demographic data, is provided by third-parties. As such, MyEListing will not be responsible for the accuracy of the information. It is strongly recommended that you verify all information with the listing agent, and any relevant agencies, prior to making any decisions.