Industrial Properties
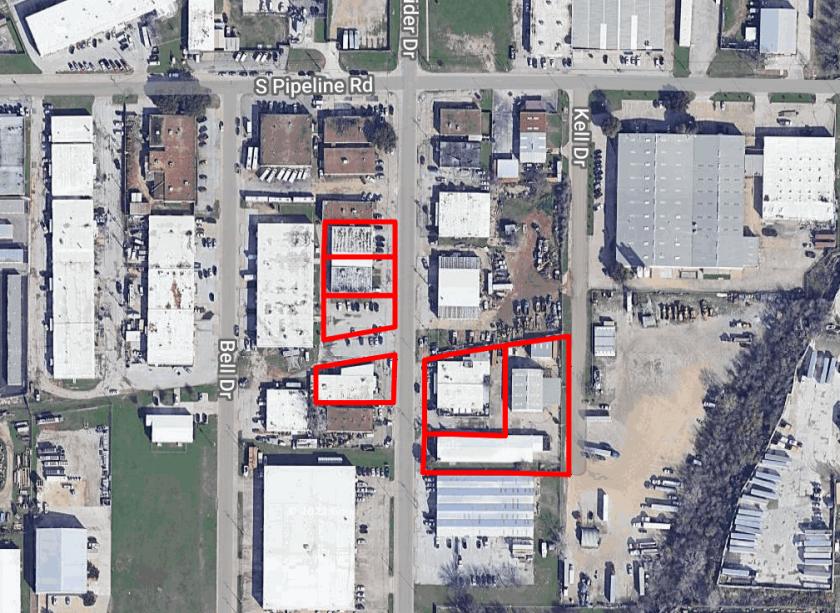
3601 Raider Drive Hurst, TX 76053
3601 Raider Drive Hurst, TX 76053
Details & Description
Property Highlights
- • Industrial Investment Portfolio
- • 100% Leased Assets
- • Seven (7) Buildings
- • 40,440 Total S.F. of Buildings
- • Close proximity to DFW Airport
- • Strong Long Term Tenants
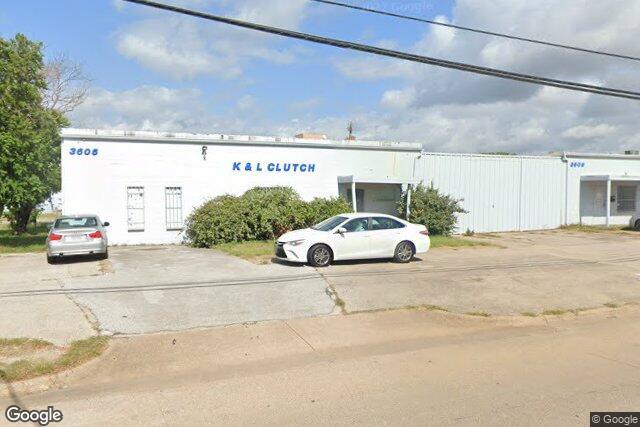
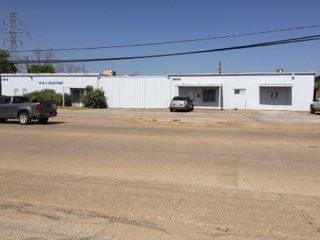
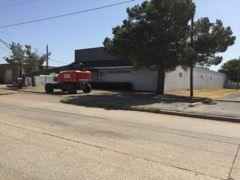
Additional Photos

Listing Agents

David Martin
O: 972-250-5800
M: 817-271-2757
dmartin@capstonecommercial.com
O: 972-250-5800
M: 817-271-2757
dmartin@capstonecommercial.com
While we strive to provide the most accurate information, all listing information, and demographic data, is provided by third-parties. As such, MyEListing will not be responsible for the accuracy of the information. It is strongly recommended that you verify all information with the listing agent, and any relevant agencies, prior to making any decisions.


