Commercial Land
Gulf Fwy League City, TX 77573
Gulf Fwy League City, TX 77573
Details & Description
Property Highlights
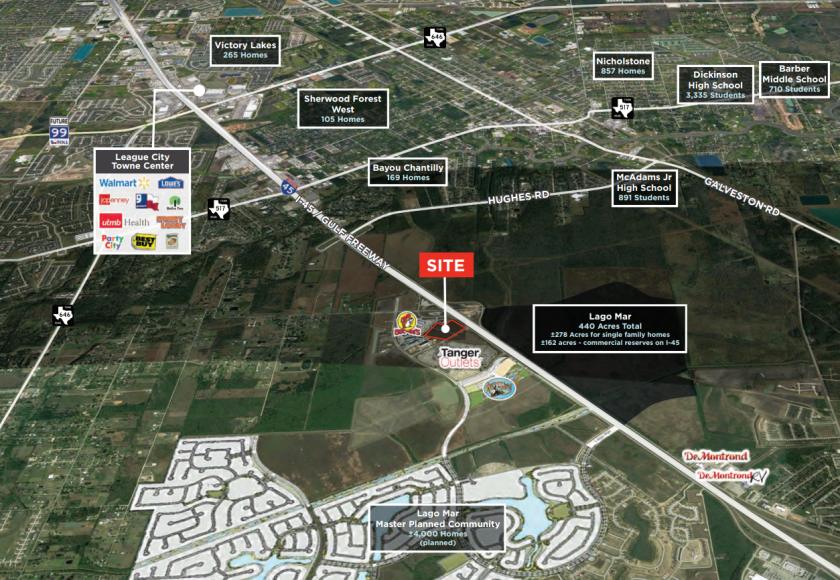
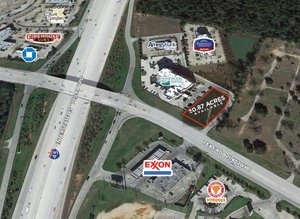
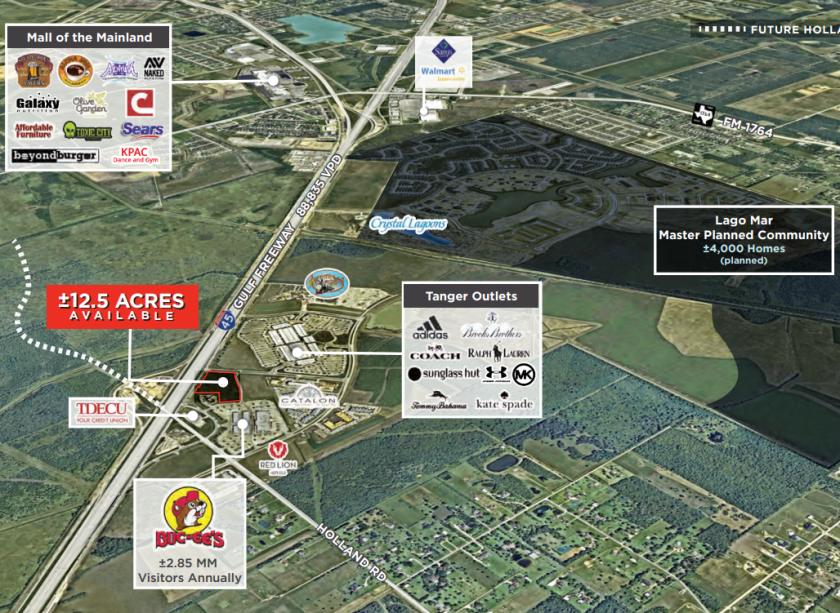
• Great opportunity for long term position in strategic corridor for a variety of uses.
• The pads are shadow anchored by Buc-ee’s and Texas City Outlet Mall.
Listing Agents

Brad LyBrand
O: 713-438-9516
blybrand@newquest.com
O: 713-438-9516
blybrand@newquest.com

Krystal Peeler
O: 281-477-4382
kpeeler@newquest.com
O: 281-477-4382
kpeeler@newquest.com
While we strive to provide the most accurate information, all listing information, and demographic data, is provided by third-parties. As such, MyEListing will not be responsible for the accuracy of the information. It is strongly recommended that you verify all information with the listing agent, and any relevant agencies, prior to making any decisions.