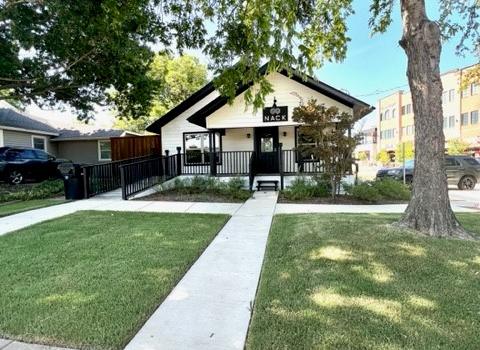
Office Space
7274 Elm Street Frisco, TX 75034
7274 Elm Street Frisco, TX 75034
Details & Description
Property Highlights
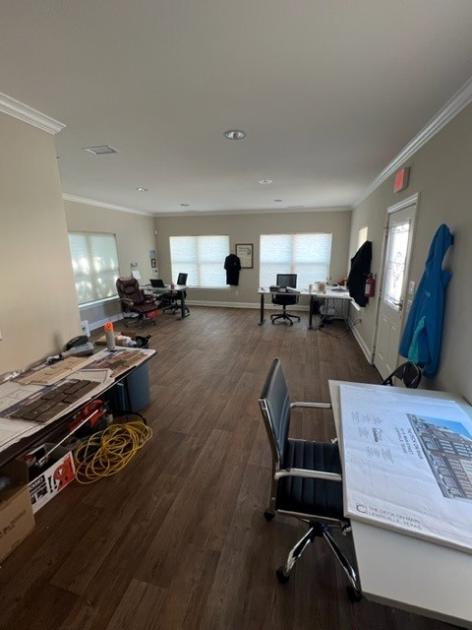
- • Spacious and open layout
- • Abundant Parking - 22 spaces
- • Sale Lease-back option available
Additional Photos


Listing Agents

Kelly Lyons
M: 214-282-2763
kelly@nackrealty.com
M: 214-282-2763
kelly@nackrealty.com
While we strive to provide the most accurate information, all listing information, and demographic data, is provided by third-parties. As such, MyEListing will not be responsible for the accuracy of the information. It is strongly recommended that you verify all information with the listing agent, and any relevant agencies, prior to making any decisions.


