Office Space
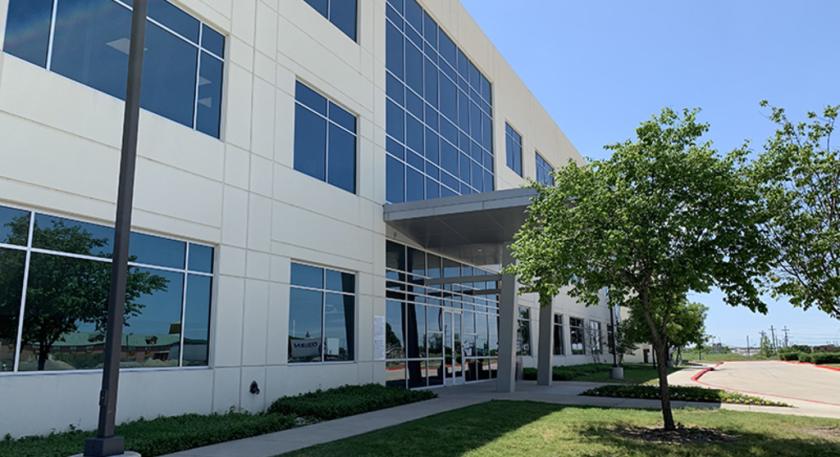
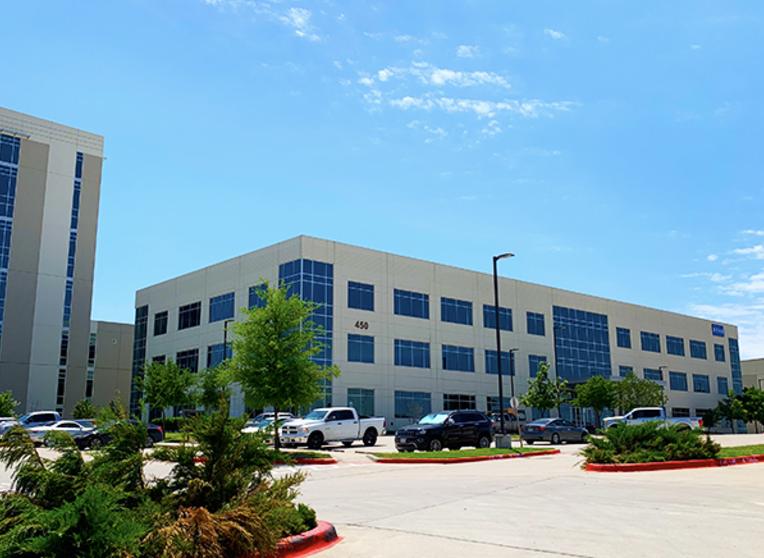
450 Century Parkway Allen, TX 75013
450 Century Parkway Allen, TX 75013
Details & Description
Property Highlights
- • Fitness Center: Yes with Locker Rooms
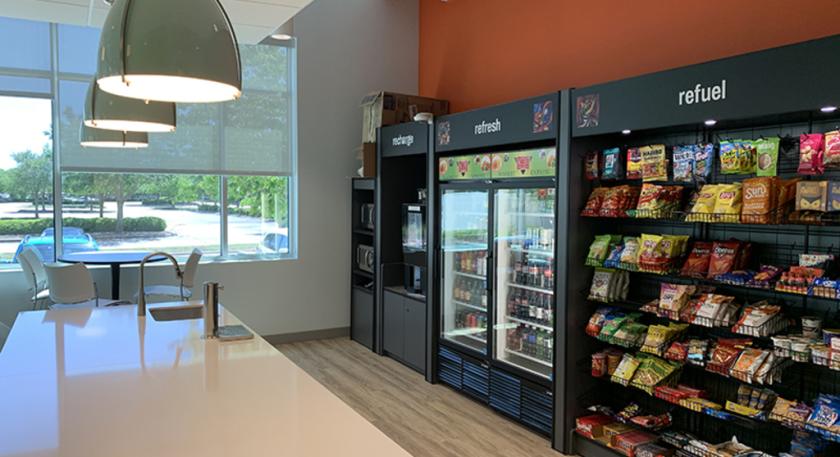
- • Café/Deli: Coffee Shop/Cafe
- • Security: Security System
- • On-site Management: Property Manager On-Site
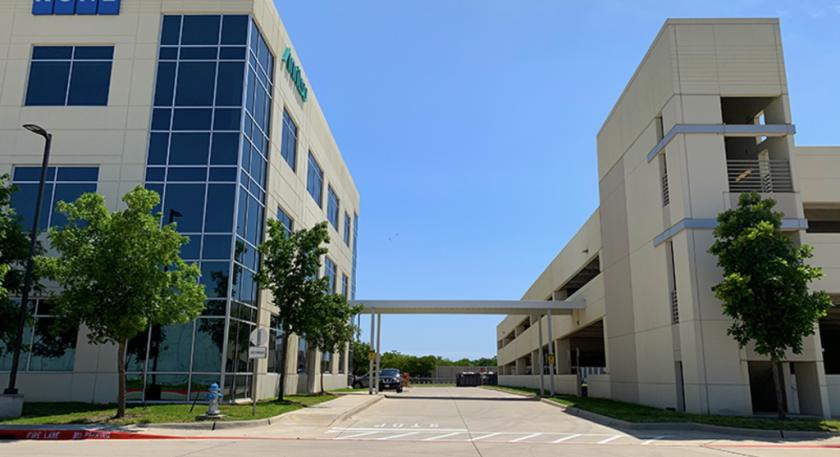
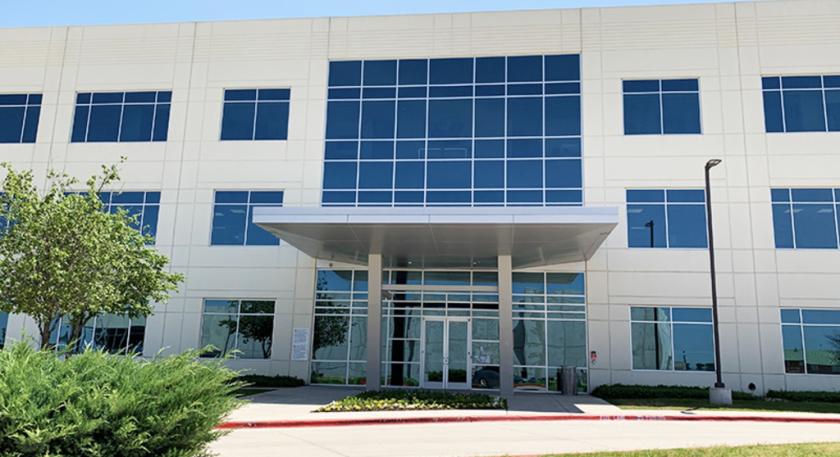
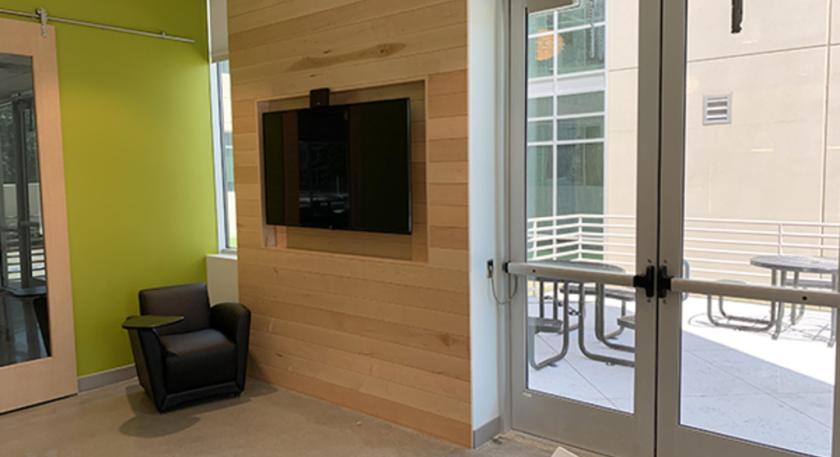
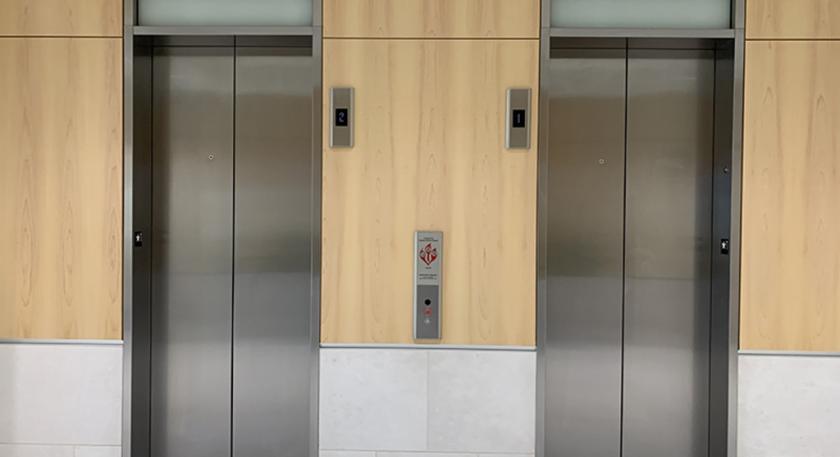
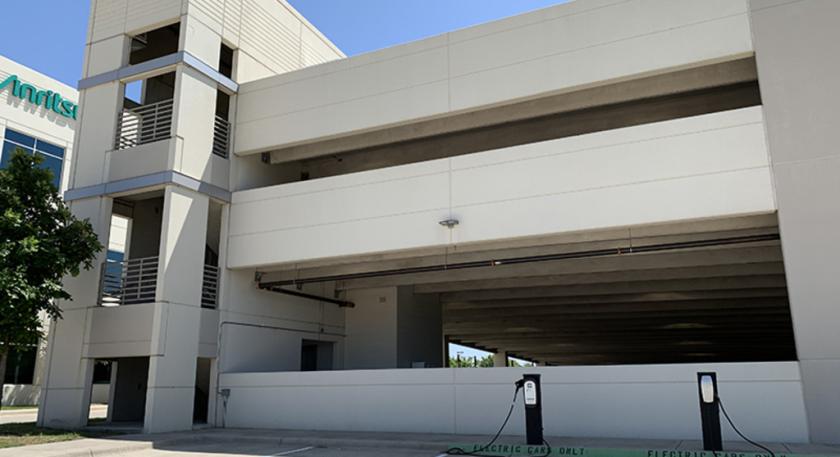
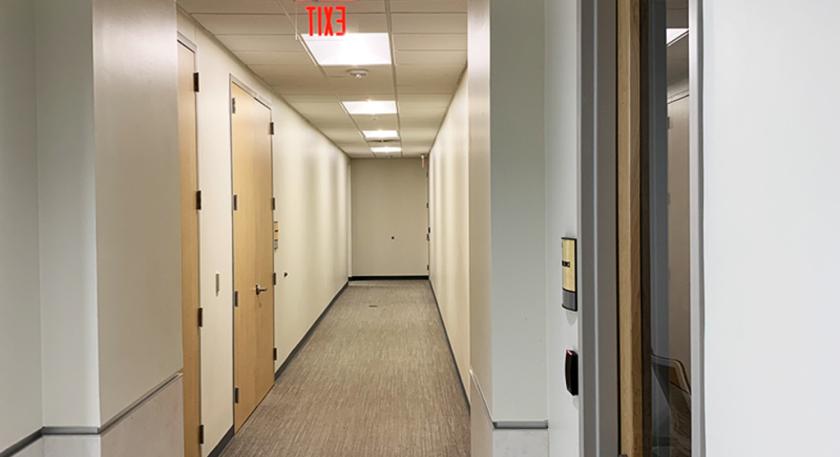
Additional Photos


Listing Agents

Richmond Collinsworth
O: 972-776-7041
rcollinsworth@bradford.com
O: 972-776-7041
rcollinsworth@bradford.com
While we strive to provide the most accurate information, all listing information, and demographic data, is provided by third-parties. As such, MyEListing will not be responsible for the accuracy of the information. It is strongly recommended that you verify all information with the listing agent, and any relevant agencies, prior to making any decisions.