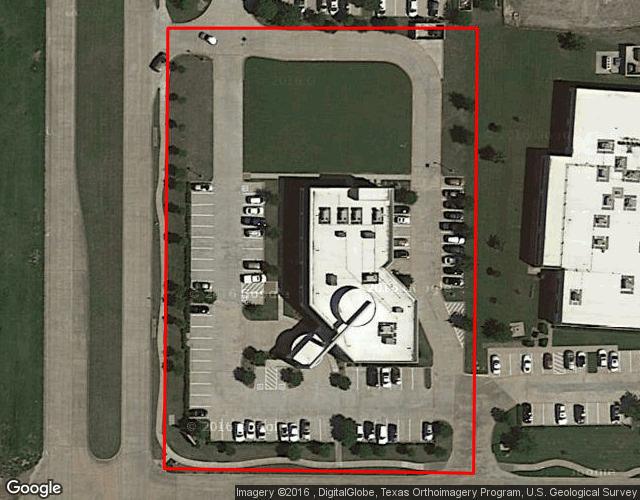
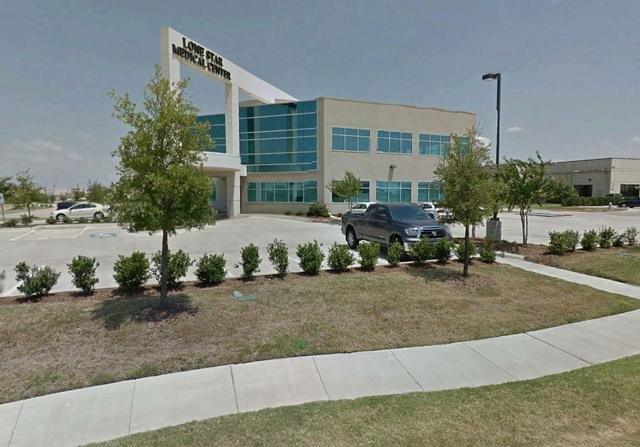
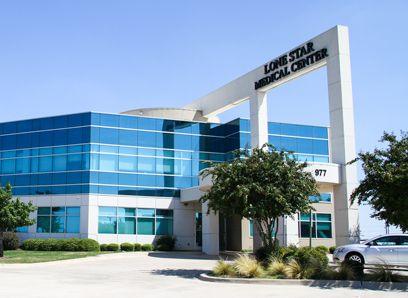
1-Mile | 3-Miles | 5-Miles | ||
---|---|---|---|---|
Total Population | 9,930 | 98,620 | 271,491 | |
Population Median Age | 37 | 36 | 36 | |
Population by Age | 0-9 Yrs | 1111 (11%) | 13911 (14%) | 38190 (14%) |
10-19 Yrs | 1642 (16%) | 15186 (15%) | 42245 (15%) | |
20-29 Yrs | 1138 (11%) | 11695 (11%) | 28720 (10%) | |
30-39 Yrs | 1369 (13%) | 12231 (12%) | 36996 (13%) | |
40-49 Yrs | 1680 (16%) | 16404 (16%) | 47313 (17%) | |
50-59 Yrs | 1441 (14%) | 14194 (14%) | 37695 (13%) | |
60-69 Yrs | 736 (7%) | 8826 (8%) | 23557 (8%) | |
70+ Yrs | 814 (8%) | 6174 (6%) | 16774 (6%) | |
Median HH Income | $78,903 | $98,078 | $104,049 | |
Total Household Income | < 24K | 374 (9%) | 2867 (8%) | 7088 (7%) |
25-49K | 782 (19%) | 4773 (13%) | 11988 (12%) | |
50-74K | 724 (18%) | 5274 (15%) | 13550 (14%) | |
75-99K | 489 (12%) | 4672 (13%) | 12210 (13%) | |
100-199K | 933 (23%) | 10905 (31%) | 32690 (35%) | |
200K+ | 610 (15%) | 5963 (17%) | 15718 (16%) | |
Highest Education Level | No Diploma | 241 | 2730 | 7561 |
Diploma or GED | 1137 | 9129 | 23167 | |
Some College | 1227 | 12830 | 34076 | |
Assoc. Degree | 458 | 5110 | 13323 | |
Bachelors Degree | 2335 | 21096 | 62505 | |
Higher Degree | 1226 | 12906 | 36130 | |
Total Housing Units | 4,100 | 36,185 | 97,467 | |
--Owner-Occupied | 1,552 | 22,631 | 63,551 | |
--Renter-Occupied | 2,359 | 11,824 | 29,693 | |
Owner-Occupied Values | < 100K | 33 | 522 | 1211 |
100-199K | 167 | 3437 | 7795 | |
200-299K | 309 | 6970 | 19586 | |
300-399K | 305 | 5083 | 17309 | |
400-499K | 449 | 3272 | 8814 | |
500K+ | 290 | 3348 | 8837 | |
Total Working Age Population | 7,670 | 75,394 | 206,229 | |
In Work Force | 5,322 | 54,087 | 147,447 | |
Not In Work Force | 2,348 | 21,307 | 58,782 | |
Workforce Employed | 5,042 | 51,696 | 141,512 | |
Workforce Unemployed | 280 | 2,375 | 5,879 | |
Civlian Workforce | 5,322 | 54,071 | 147,390 | |
Military Workforce | 0 | 17 | 56 | |
Total Households | 3,912 | 34,454 | 93,243 | |
Family Households | 2,495 | 26,067 | 72,045 | |
Non-Family Households | 1,417 | 8,387 | 21,198 | |
Married Couple | 1,817 | 21,356 | 59,704 | |
Other Family | 678 | 4,711 | 12,341 | |
Married w/Child | 1,048 | 11,599 | 32,880 | |
Single Male w/Child | 80 | 472 | 1,551 | |
Single Female w/Child | 292 | 1,922 | 5,208 |
Population Change Last Two Decades - Plus Projection
2000 | % | 2010 | % | 2020 | % | 2030 | |
---|---|---|---|---|---|---|---|
Texas | 20,851,820 | +21 | 25,145,561 | +18 | 29,677,668 | +18 | 34,894,452 |
Collin County | 491,675 | +59 | 782,341 | +33 | 1,039,369 | +34 | 1,391,461 |
Total Working Age Population:
Total Households:
Total Working Age Population:
Total Households:
Total Working Age Population:
Total Households: