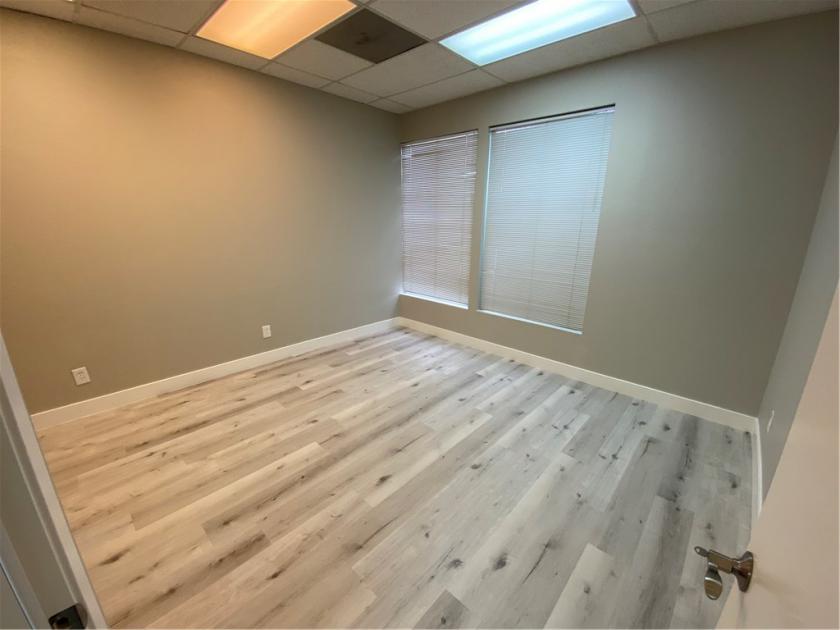
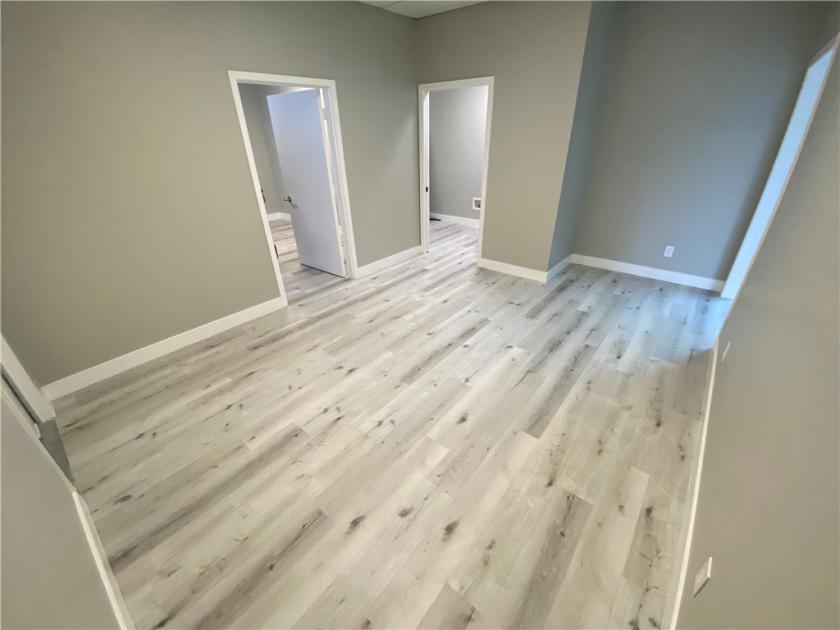
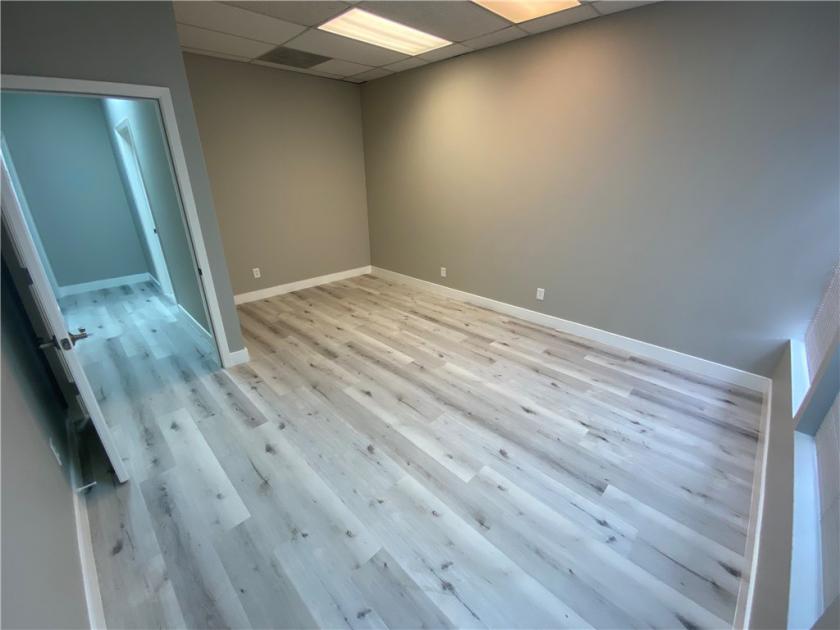
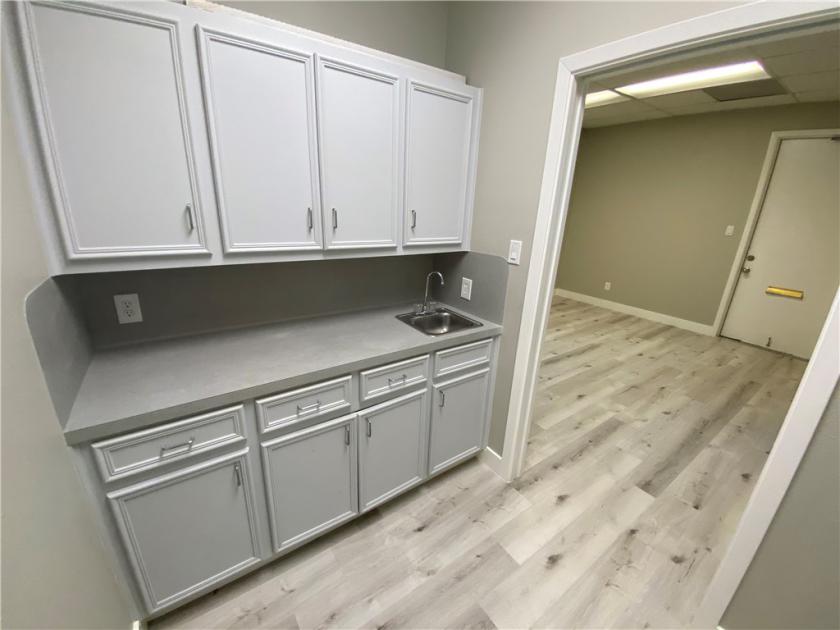
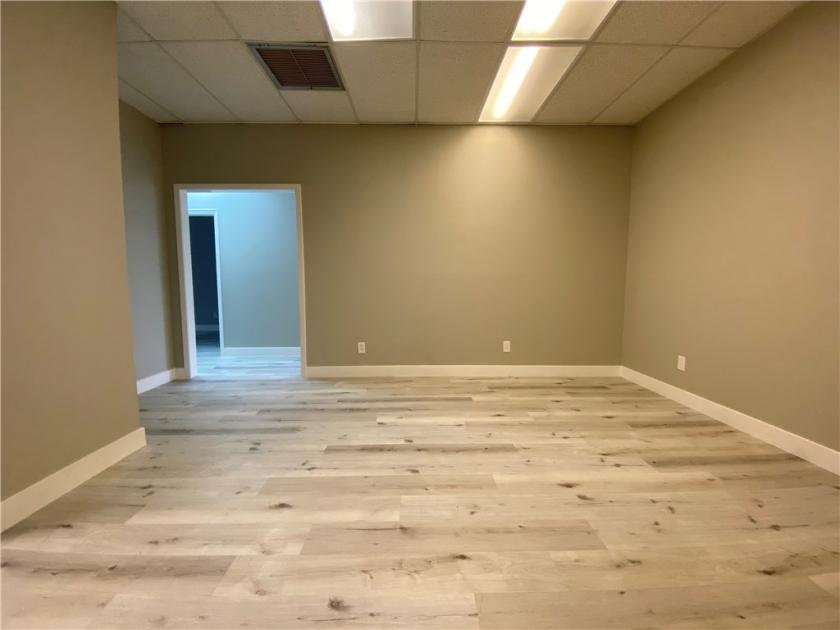
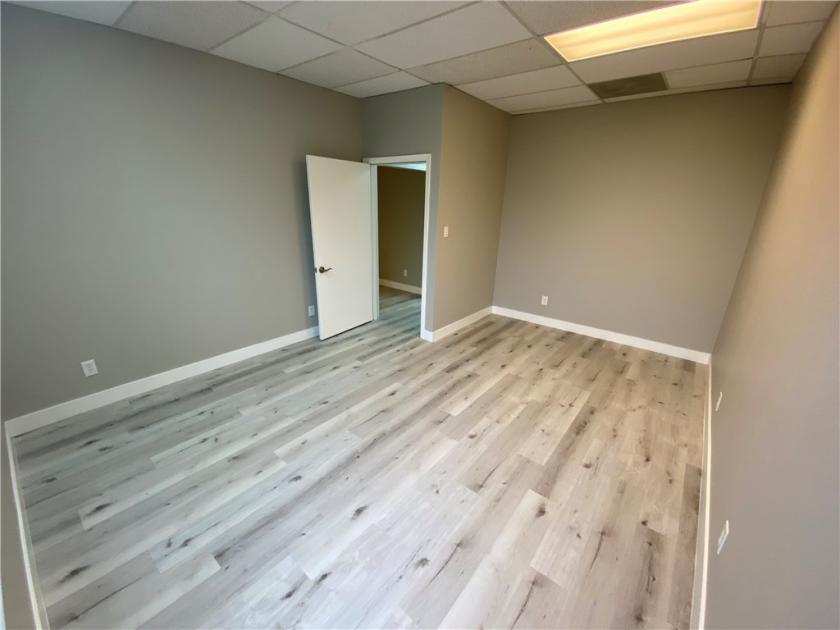
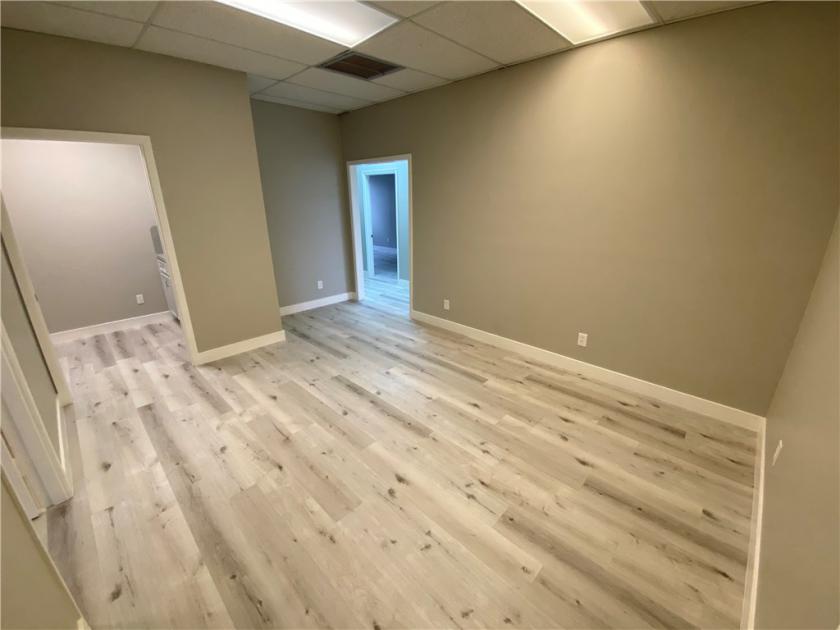
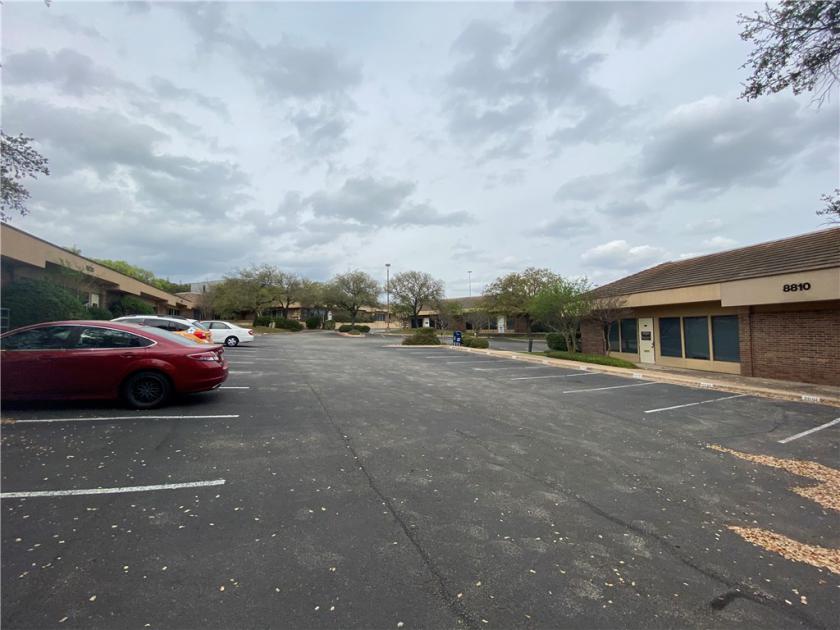
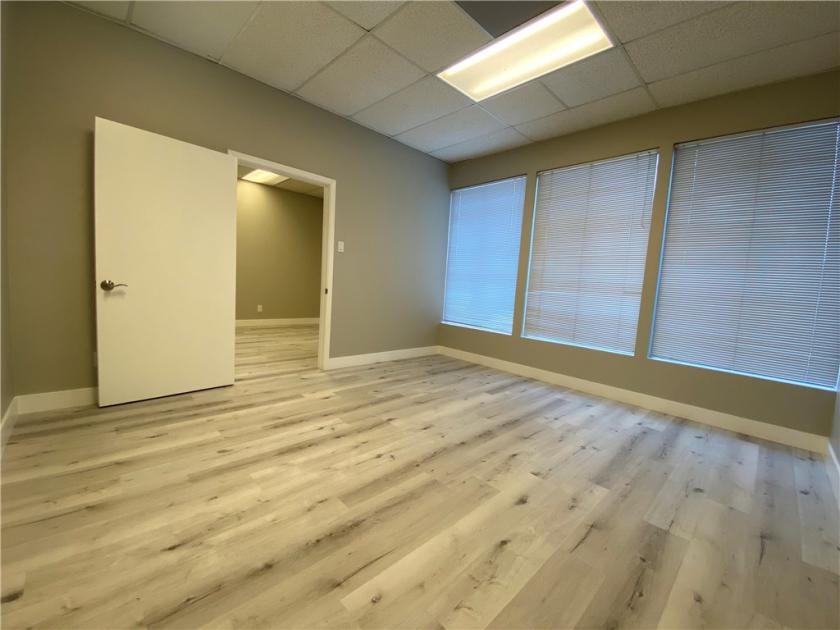
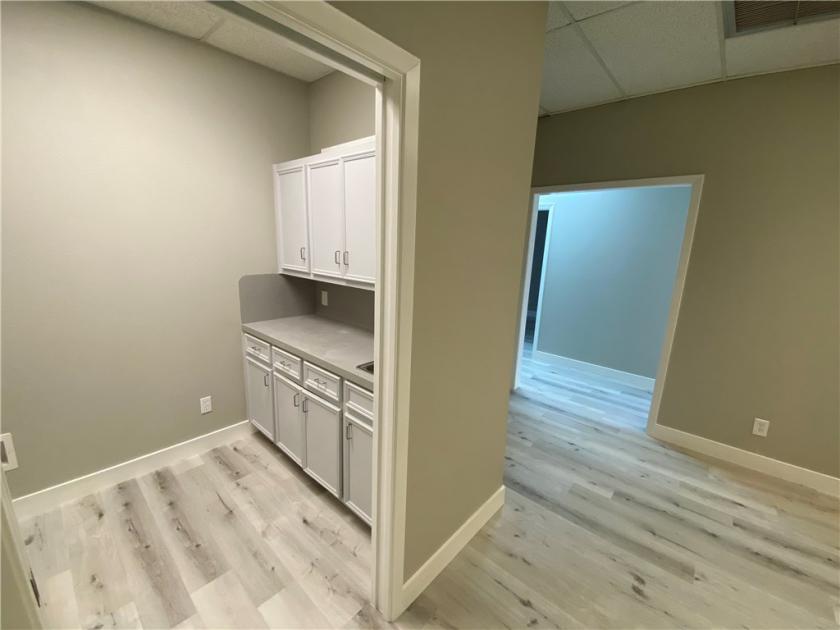
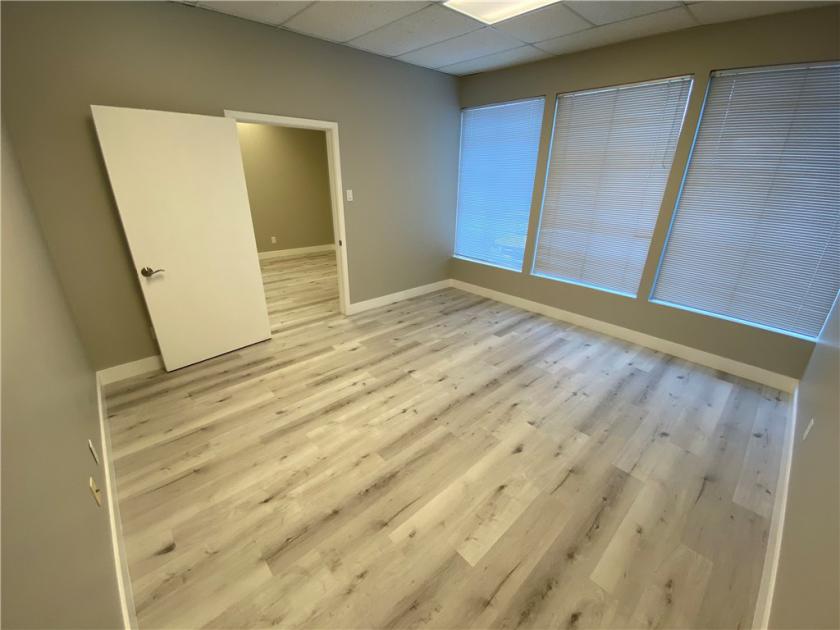
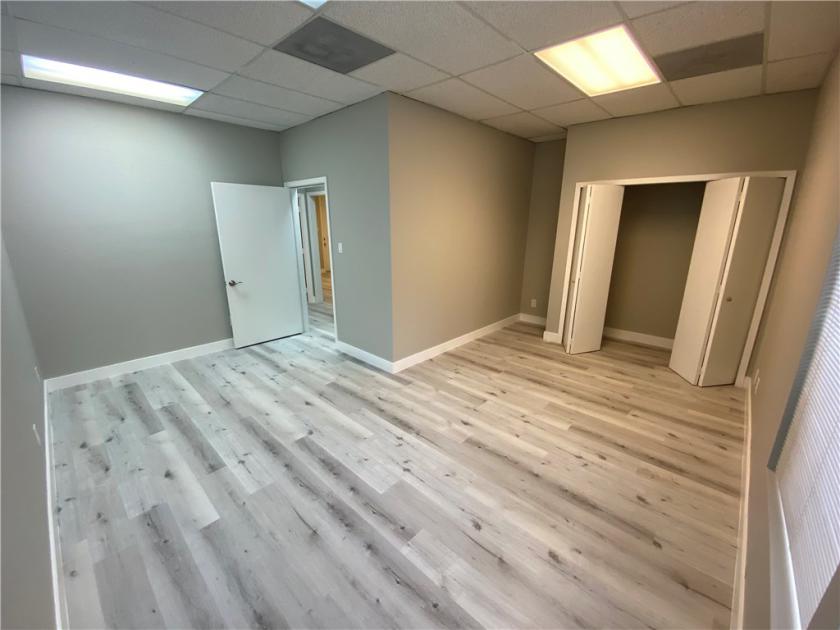
Office Space
8820 Business Park Dr Unit 300 Austin, TX 78759
8820 Business Park Dr Unit 300 Austin, TX 78759
Details & Description
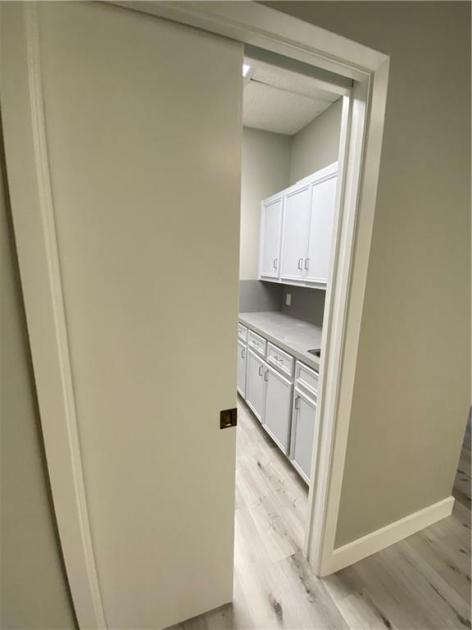
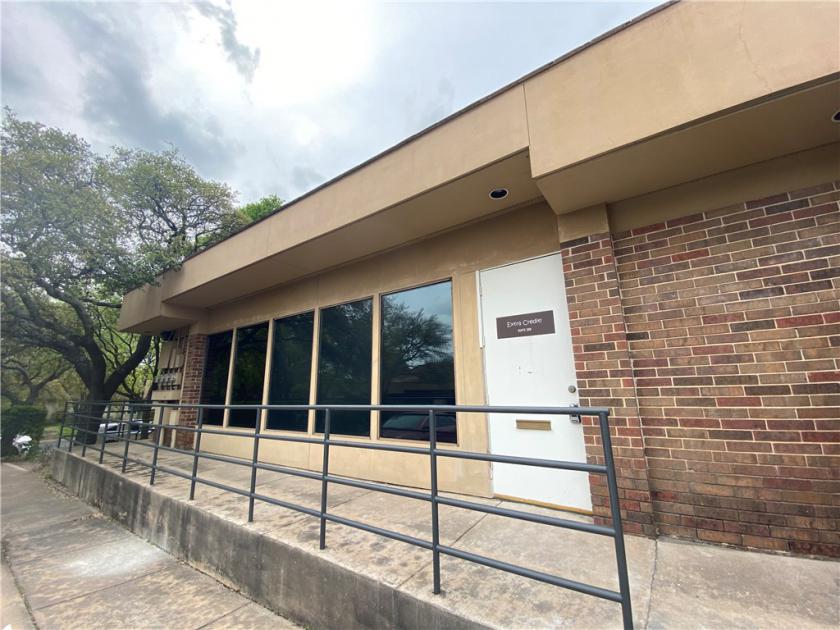
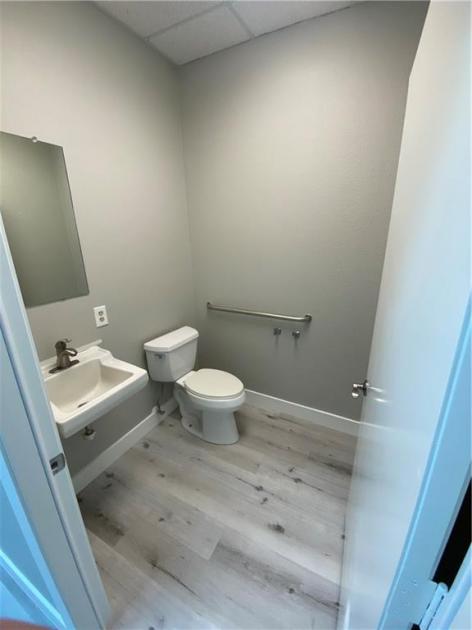
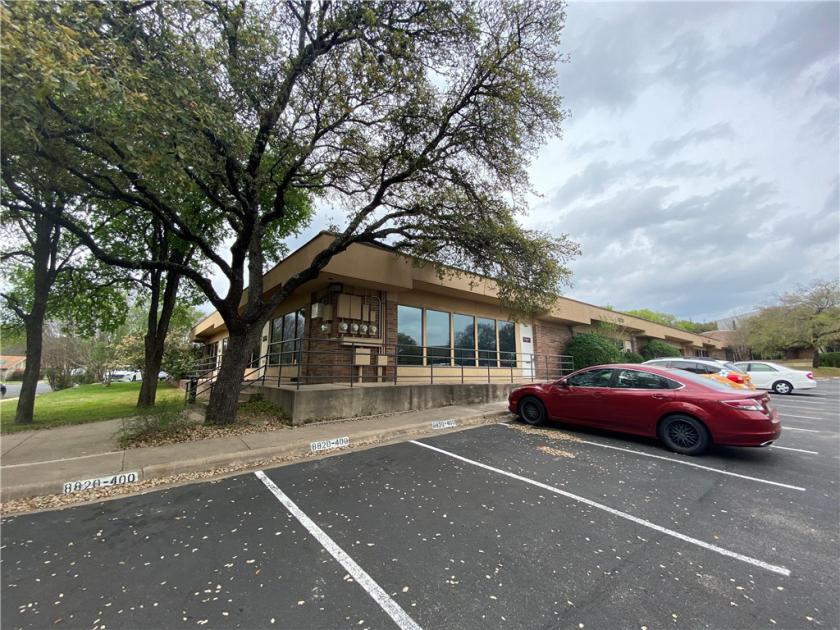
Additional Photos
Listing Agents

Christine Choate
Horizon Realty
O: 512-342-1800
M: 512-342-1800
commercial@horizonrealtyaustin.com
Horizon Realty
O: 512-342-1800
M: 512-342-1800
commercial@horizonrealtyaustin.com
While we strive to provide the most accurate information, all listing information, and demographic data, is provided by third-parties. As such, MyEListing will not be responsible for the accuracy of the information. It is strongly recommended that you verify all information with the listing agent, and any relevant agencies, prior to making any decisions.