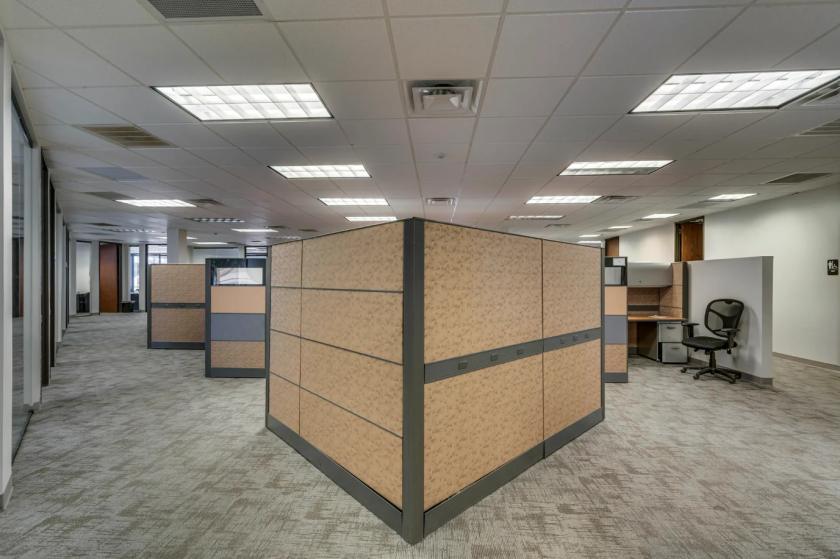
Office Space
1600 Corporate Court Irving, TX 75038
1600 Corporate Court Irving, TX 75038
Details & Description
Property Highlights
- • In place income of $210,896/year
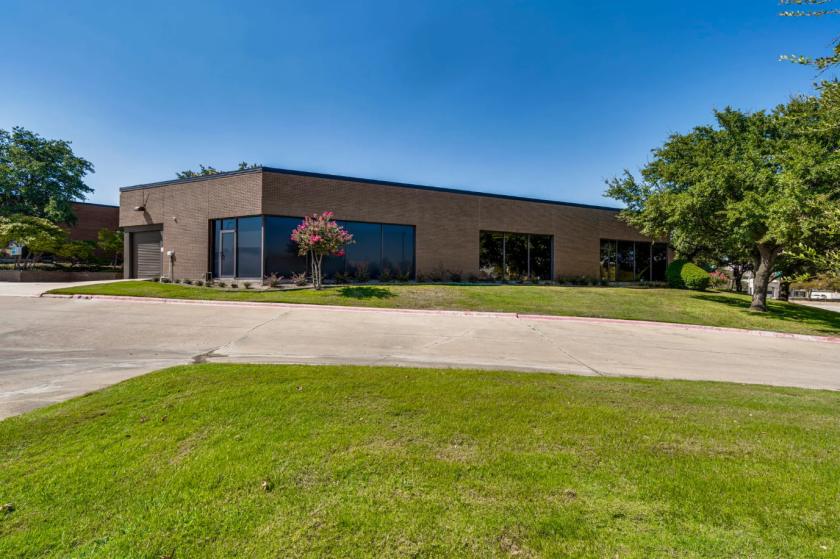
- • New Roof in 2021
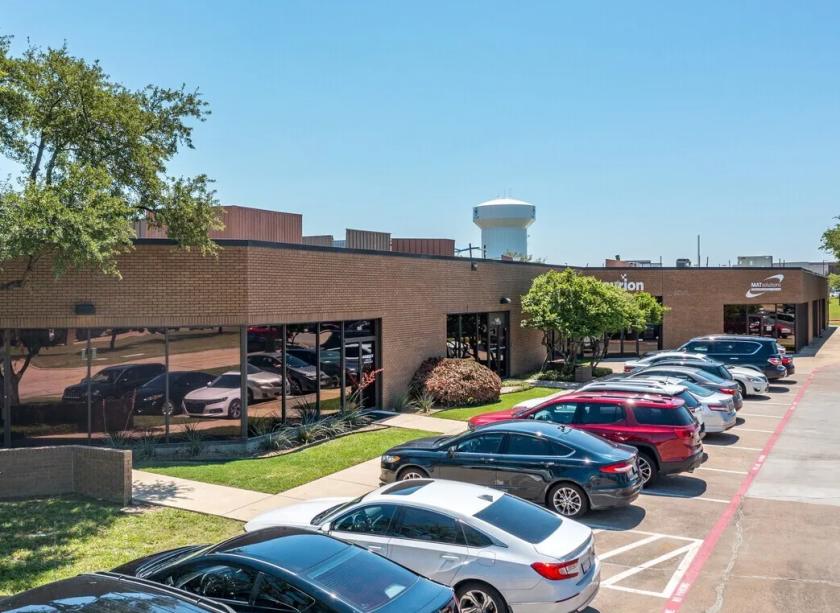
- • Monument and Building Signage
- • Convenient Door-side Parking
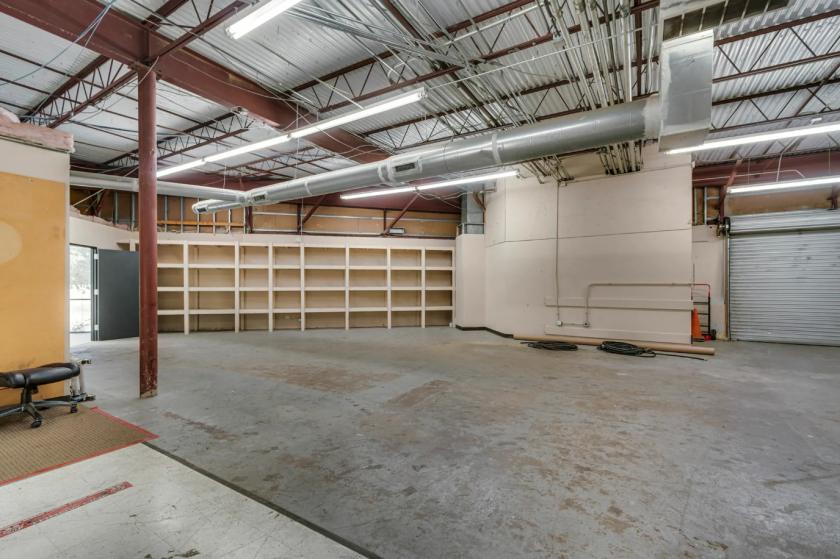
- • 1 Grade Level Door
- • 14’ Clear Height
Additional Photos


Listing Agents

Michelle Hudson
O: 214-389-3663
M: 214-534-0226
Hudson@HudsonPeters.com
O: 214-389-3663
M: 214-534-0226
Hudson@HudsonPeters.com

Tom Hudson
Hudson Peters Commercial
O: 214-389-3667
M: 214-389-3667
tom@hudsonpeters.com
Hudson Peters Commercial
O: 214-389-3667
M: 214-389-3667
tom@hudsonpeters.com
While we strive to provide the most accurate information, all listing information, and demographic data, is provided by third-parties. As such, MyEListing will not be responsible for the accuracy of the information. It is strongly recommended that you verify all information with the listing agent, and any relevant agencies, prior to making any decisions.