Industrial Properties
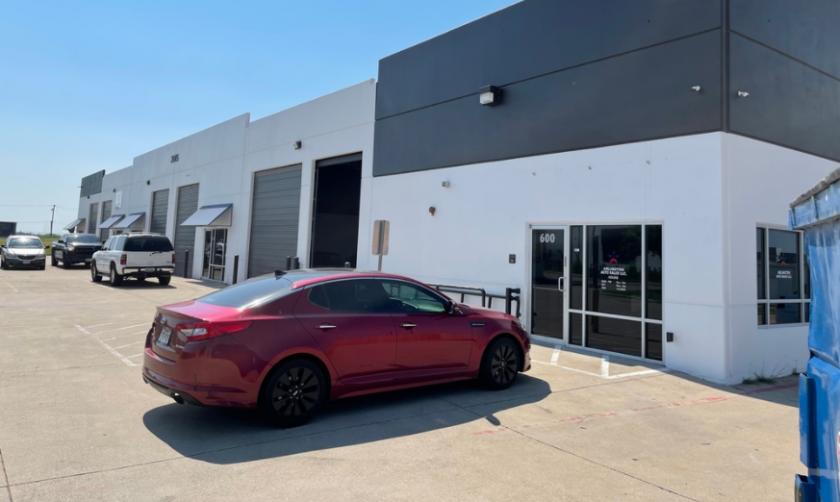
3015 Eagle Drive Grand Prairie, TX 75052
3015 Eagle Drive Grand Prairie, TX 75052
Details & Description
Property Highlights
- • 100 leased
- • Near growing southern Dallas suburbs
- • Excellent location near I-20 and Highway 360
- • Very limited industrial inventory in this area
- • Built in rent increases
Listing Agents

David Dunaway
O: 972-679-9845
ddunaway@kwcommercial.com
O: 972-679-9845
ddunaway@kwcommercial.com
While we strive to provide the most accurate information, all listing information, and demographic data, is provided by third-parties. As such, MyEListing will not be responsible for the accuracy of the information. It is strongly recommended that you verify all information with the listing agent, and any relevant agencies, prior to making any decisions.