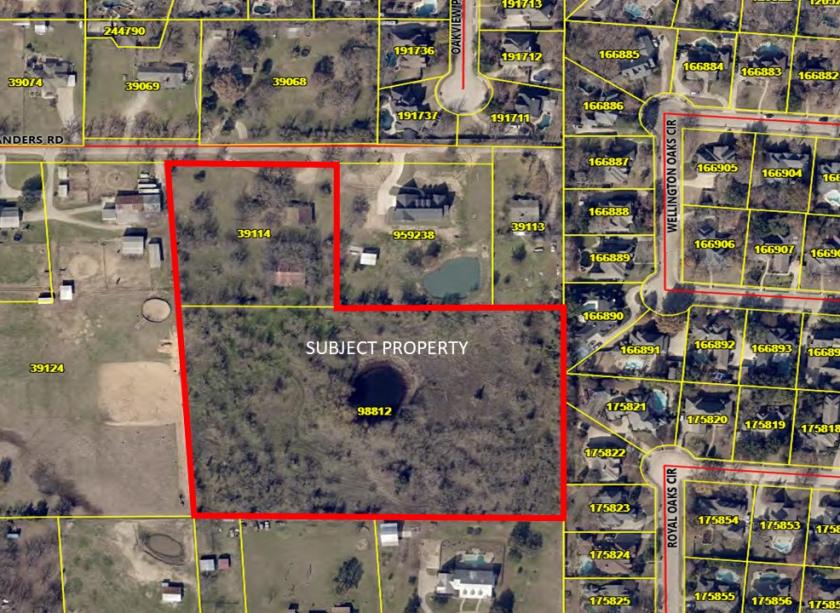
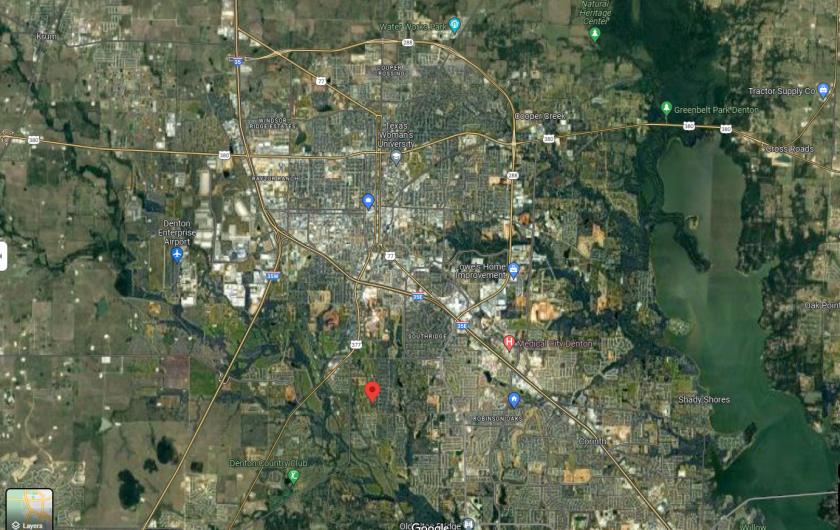
1-Mile | 3-Miles | 5-Miles | ||
---|---|---|---|---|
Total Population | 4,260 | 56,953 | 139,590 | |
Population Median Age | 40 | 35 | 34 | |
Population by Age | 0-9 Yrs | 376 (8%) | 5455 (9%) | 15668 (11%) |
10-19 Yrs | 531 (12%) | 7667 (13%) | 22258 (15%) | |
20-29 Yrs | 790 (18%) | 15124 (26%) | 32159 (23%) | |
30-39 Yrs | 410 (9%) | 7156 (12%) | 17929 (12%) | |
40-49 Yrs | 618 (14%) | 7028 (12%) | 17380 (12%) | |
50-59 Yrs | 656 (15%) | 6525 (11%) | 15883 (11%) | |
60-69 Yrs | 386 (9%) | 4362 (7%) | 9631 (6%) | |
70+ Yrs | 493 (11%) | 3637 (6%) | 8682 (6%) | |
Median HH Income | $91,095 | $73,131 | $70,498 | |
Total Household Income | < 24K | 110 (7%) | 3291 (17%) | 7836 (16%) |
25-49K | 254 (17%) | 3324 (17%) | 8901 (19%) | |
50-74K | 232 (15%) | 3152 (16%) | 7626 (16%) | |
75-99K | 202 (13%) | 2526 (13%) | 5628 (12%) | |
100-199K | 413 (28%) | 5180 (27%) | 11650 (25%) | |
200K+ | 241 (16%) | 1660 (8%) | 4643 (10%) | |
Highest Education Level | No Diploma | 138 | 3228 | 6646 |
Diploma or GED | 376 | 6035 | 14582 | |
Some College | 824 | 8398 | 19701 | |
Assoc. Degree | 245 | 2460 | 5947 | |
Bachelors Degree | 901 | 9628 | 22594 | |
Higher Degree | 367 | 5209 | 12496 | |
Total Housing Units | 1,597 | 20,645 | 50,330 | |
--Owner-Occupied | 1,001 | 10,544 | 25,479 | |
--Renter-Occupied | 450 | 8,589 | 20,805 | |
Owner-Occupied Values | < 100K | 71 | 976 | 2227 |
100-199K | 182 | 1598 | 4782 | |
200-299K | 285 | 4548 | 9261 | |
300-399K | 261 | 2049 | 4743 | |
400-499K | 112 | 664 | 2082 | |
500K+ | 90 | 711 | 2383 | |
Total Working Age Population | 3,628 | 47,852 | 115,098 | |
In Work Force | 2,309 | 33,838 | 78,596 | |
Not In Work Force | 1,319 | 14,014 | 36,502 | |
Workforce Employed | 2,187 | 32,332 | 74,720 | |
Workforce Unemployed | 122 | 1,482 | 3,827 | |
Civlian Workforce | 2,309 | 33,813 | 78,547 | |
Military Workforce | 0 | 24 | 49 | |
Total Households | 1,452 | 19,132 | 46,284 | |
Family Households | 1,054 | 12,017 | 29,165 | |
Non-Family Households | 397 | 7,115 | 17,120 | |
Married Couple | 894 | 9,094 | 22,760 | |
Other Family | 161 | 2,924 | 6,405 | |
Married w/Child | 369 | 4,328 | 10,768 | |
Single Male w/Child | 0 | 334 | 834 | |
Single Female w/Child | 59 | 1,046 | 2,359 |
Population Change Last Two Decades - Plus Projection
2000 | % | 2010 | % | 2020 | % | 2030 | |
---|---|---|---|---|---|---|---|
Texas | 20,851,820 | +21 | 25,145,561 | +18 | 29,677,668 | +18 | 34,894,452 |
Denton County | 432,976 | +53 | 662,614 | +36 | 897,953 | +37 | 1,234,110 |
Total Working Age Population:
Total Households:
Total Working Age Population:
Total Households:
Total Working Age Population:
Total Households: