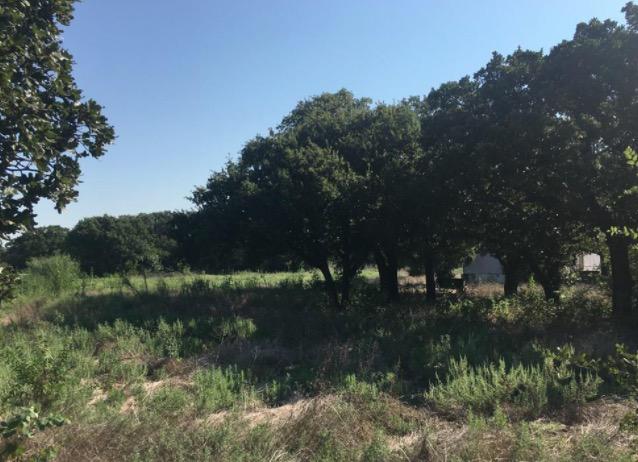
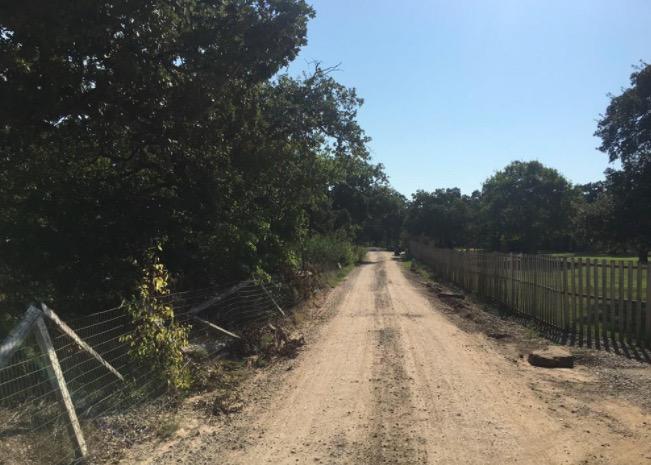
1-Mile | 3-Miles | 5-Miles | ||
---|---|---|---|---|
Total Population | 4,376 | 53,227 | 125,519 | |
Population Median Age | 32 | 35 | 35 | |
Population by Age | 0-9 Yrs | 771 (17%) | 7602 (14%) | 15992 (12%) |
10-19 Yrs | 574 (13%) | 7262 (13%) | 16943 (13%) | |
20-29 Yrs | 641 (14%) | 8492 (15%) | 25220 (20%) | |
30-39 Yrs | 779 (17%) | 7729 (14%) | 17629 (14%) | |
40-49 Yrs | 711 (16%) | 7318 (13%) | 16650 (13%) | |
50-59 Yrs | 473 (10%) | 6816 (12%) | 15333 (12%) | |
60-69 Yrs | 304 (6%) | 4747 (8%) | 10139 (8%) | |
70+ Yrs | 123 (2%) | 3262 (6%) | 7613 (6%) | |
Median HH Income | $93,911 | $81,543 | $70,187 | |
Total Household Income | < 24K | 97 (6%) | 2126 (11%) | 7162 (16%) |
25-49K | 255 (17%) | 3263 (18%) | 8514 (19%) | |
50-74K | 198 (13%) | 2842 (15%) | 7390 (17%) | |
75-99K | 236 (16%) | 2663 (14%) | 6133 (14%) | |
100-199K | 536 (36%) | 5803 (32%) | 11359 (26%) | |
200K+ | 135 (9%) | 1160 (6%) | 2845 (6%) | |
Highest Education Level | No Diploma | 213 | 3018 | 7159 |
Diploma or GED | 525 | 6622 | 15828 | |
Some College | 555 | 8408 | 20030 | |
Assoc. Degree | 165 | 2891 | 6087 | |
Bachelors Degree | 821 | 8753 | 19755 | |
Higher Degree | 426 | 4465 | 9913 | |
Total Housing Units | 1,553 | 18,871 | 46,584 | |
--Owner-Occupied | 965 | 12,090 | 25,960 | |
--Renter-Occupied | 491 | 5,767 | 17,444 | |
Owner-Occupied Values | < 100K | 126 | 1329 | 3090 |
100-199K | 185 | 3488 | 8561 | |
200-299K | 403 | 4853 | 8598 | |
300-399K | 211 | 1867 | 3701 | |
400-499K | 32 | 353 | 1066 | |
500K+ | 8 | 199 | 943 | |
Total Working Age Population | 3,253 | 41,301 | 100,007 | |
In Work Force | 2,473 | 28,998 | 70,803 | |
Not In Work Force | 780 | 12,303 | 29,204 | |
Workforce Employed | 2,352 | 27,647 | 67,023 | |
Workforce Unemployed | 102 | 1,310 | 3,696 | |
Civlian Workforce | 2,454 | 28,957 | 70,719 | |
Military Workforce | 19 | 41 | 84 | |
Total Households | 1,457 | 17,857 | 43,404 | |
Family Households | 1,090 | 13,157 | 28,602 | |
Non-Family Households | 367 | 4,699 | 14,802 | |
Married Couple | 924 | 10,377 | 22,026 | |
Other Family | 166 | 2,780 | 6,576 | |
Married w/Child | 541 | 5,231 | 10,466 | |
Single Male w/Child | 3 | 249 | 605 | |
Single Female w/Child | 70 | 1,187 | 2,844 |
Population Change Last Two Decades - Plus Projection
2000 | % | 2010 | % | 2020 | % | 2030 | |
---|---|---|---|---|---|---|---|
Texas | 20,851,820 | +21 | 25,145,561 | +18 | 29,677,668 | +18 | 34,894,452 |
Denton County | 432,976 | +53 | 662,614 | +36 | 897,953 | +37 | 1,234,110 |
Total Working Age Population:
Total Households:
Total Working Age Population:
Total Households:
Total Working Age Population:
Total Households: