Industrial Properties
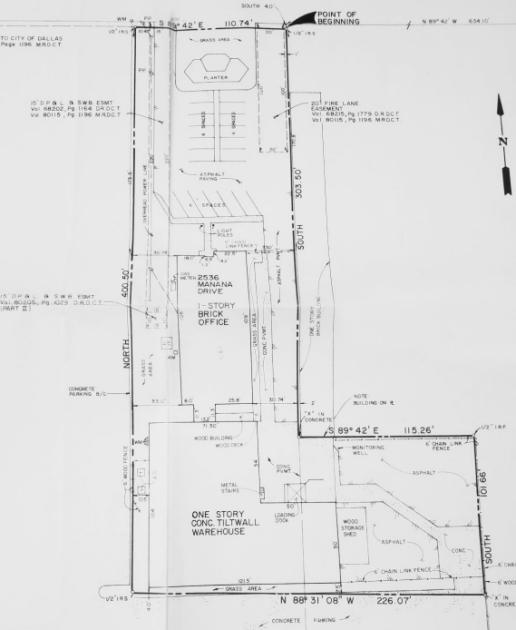
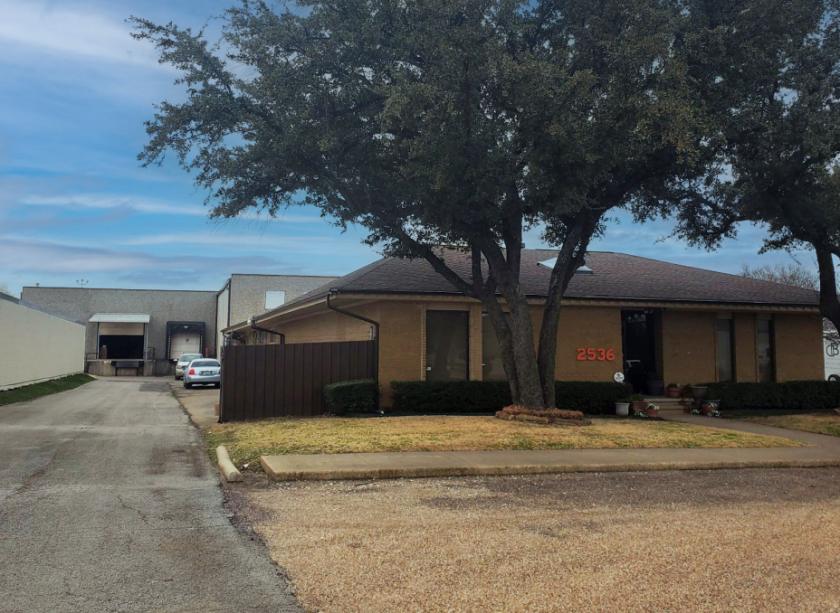
2536 Manana Drive Dallas, TX 75220
2536 Manana Drive Dallas, TX 75220
Details & Description
Property Highlights
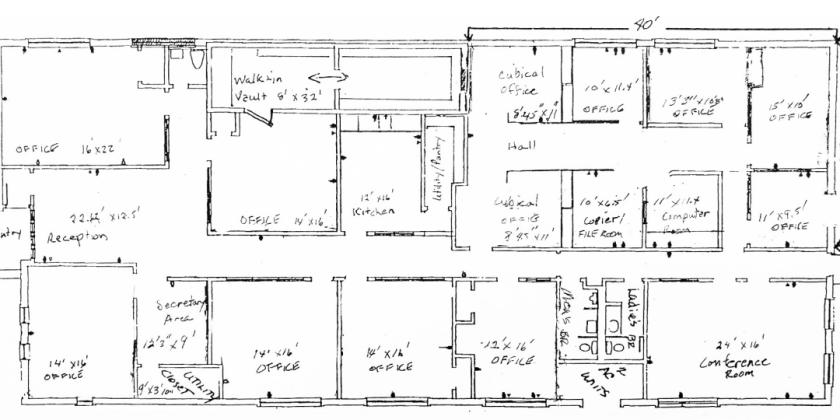
- • 5,000 SF Recently Updated Office
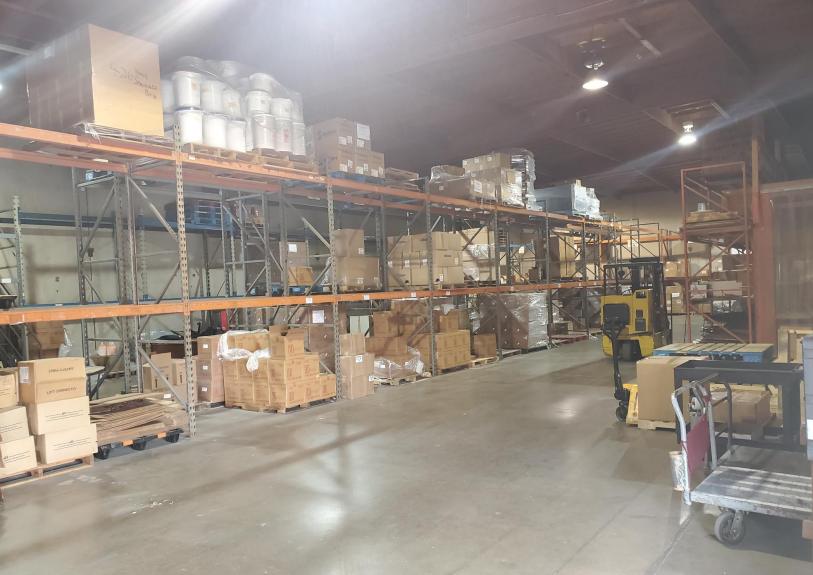
- • 3,000 SF Dropped Ceiling with Mezzanine Storage
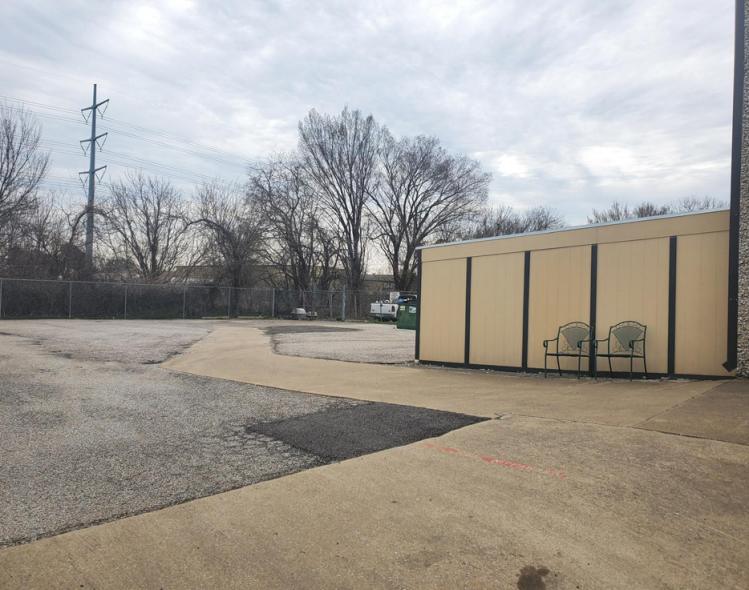
- • 10,000 SF Outside Storage
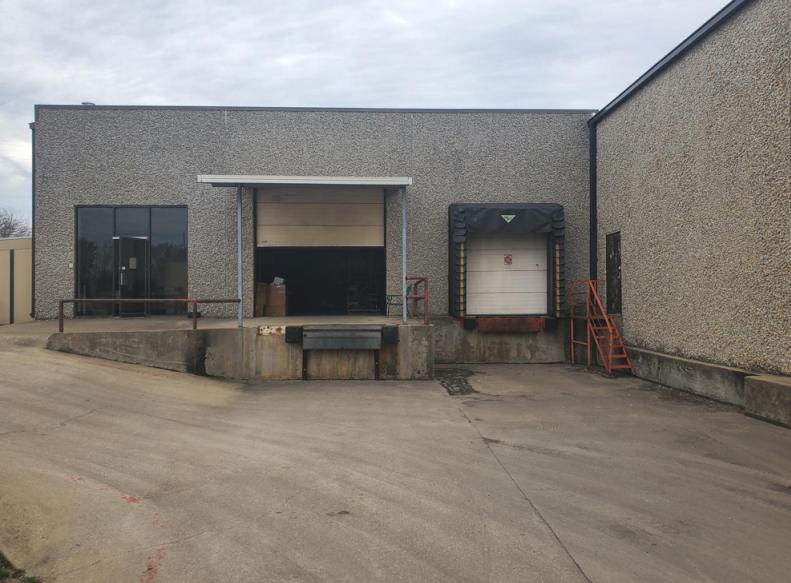
- • Dock High & Grade Level Doors
- • Potential Live-Work Space
Additional Photos


Listing Agents

Jim Svidron
O: 214-256-7172
M: 214-577-3688
jsvidron@nairl.com
O: 214-256-7172
M: 214-577-3688
jsvidron@nairl.com
While we strive to provide the most accurate information, all listing information, and demographic data, is provided by third-parties. As such, MyEListing will not be responsible for the accuracy of the information. It is strongly recommended that you verify all information with the listing agent, and any relevant agencies, prior to making any decisions.