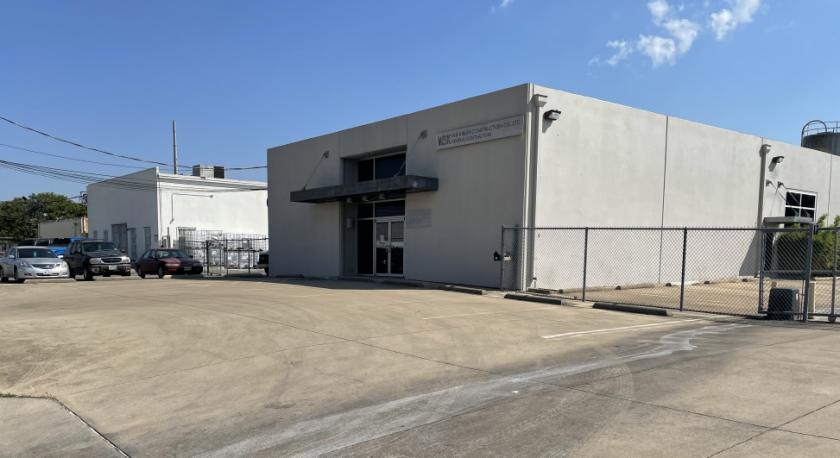
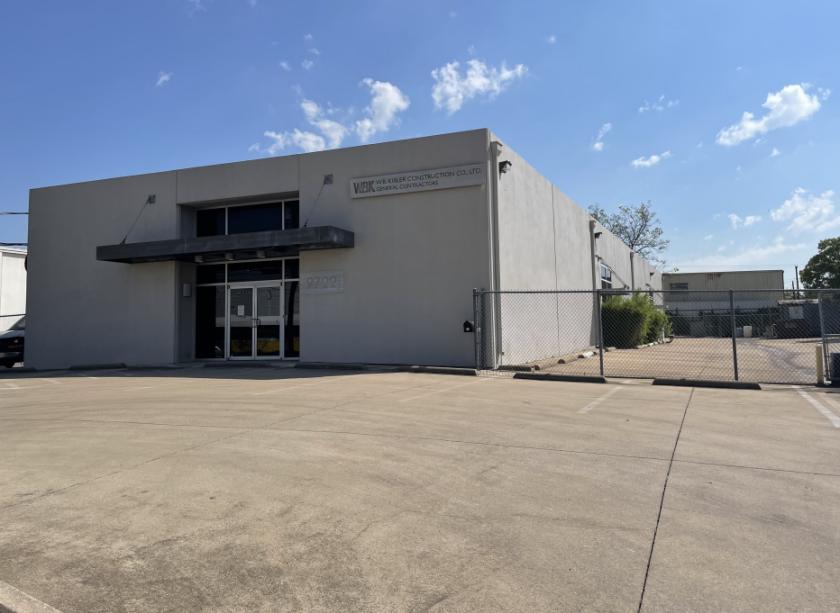
1-Mile | 3-Miles | 5-Miles | ||
---|---|---|---|---|
Total Population | 27,387 | 79,981 | 233,385 | |
Population Median Age | 29 | 34 | 36 | |
Population by Age | 0-9 Yrs | 5056 (18%) | 11881 (14%) | 30178 (12%) |
10-19 Yrs | 4511 (16%) | 11027 (13%) | 28731 (12%) | |
20-29 Yrs | 5164 (18%) | 12143 (15%) | 36700 (15%) | |
30-39 Yrs | 4740 (17%) | 14099 (17%) | 37789 (16%) | |
40-49 Yrs | 3729 (13%) | 10894 (13%) | 32268 (13%) | |
50-59 Yrs | 2491 (9%) | 9373 (11%) | 29823 (12%) | |
60-69 Yrs | 1101 (4%) | 6215 (7%) | 21341 (9%) | |
70+ Yrs | 594 (2%) | 4348 (5%) | 16556 (7%) | |
Median HH Income | $38,244 | $59,766 | $73,652 | |
Total Household Income | < 24K | 2228 (24%) | 4667 (16%) | 11718 (12%) |
25-49K | 3810 (41%) | 7536 (26%) | 18721 (20%) | |
50-74K | 1610 (17%) | 4688 (16%) | 16233 (17%) | |
75-99K | 854 (9%) | 3045 (10%) | 10727 (11%) | |
100-199K | 548 (6%) | 5170 (18%) | 19849 (21%) | |
200K+ | 47 (0%) | 3019 (10%) | 14429 (15%) | |
Highest Education Level | No Diploma | 8965 | 18426 | 32296 |
Diploma or GED | 3629 | 10029 | 24569 | |
Some College | 1458 | 6737 | 22002 | |
Assoc. Degree | 494 | 1768 | 6618 | |
Bachelors Degree | 883 | 9391 | 44008 | |
Higher Degree | 214 | 5434 | 30156 | |
Total Housing Units | 10,183 | 31,126 | 101,054 | |
--Owner-Occupied | 1,055 | 12,044 | 42,807 | |
--Renter-Occupied | 8,042 | 16,080 | 48,870 | |
Owner-Occupied Values | < 100K | 377 | 865 | 2610 |
100-199K | 351 | 2424 | 8611 | |
200-299K | 197 | 2475 | 6754 | |
300-399K | 74 | 1902 | 5107 | |
400-499K | 25 | 1330 | 3624 | |
500K+ | 31 | 3050 | 16102 | |
Total Working Age Population | 19,560 | 61,640 | 185,931 | |
In Work Force | 14,941 | 45,046 | 133,922 | |
Not In Work Force | 4,618 | 16,594 | 52,009 | |
Workforce Employed | 13,981 | 42,806 | 128,565 | |
Workforce Unemployed | 960 | 2,240 | 5,345 | |
Civlian Workforce | 14,941 | 45,046 | 133,910 | |
Military Workforce | 0 | 0 | 12 | |
Total Households | 9,097 | 28,124 | 91,677 | |
Family Households | 6,035 | 19,039 | 56,328 | |
Non-Family Households | 3,062 | 9,085 | 35,349 | |
Married Couple | 3,470 | 13,480 | 42,475 | |
Other Family | 2,565 | 5,559 | 13,854 | |
Married w/Child | 2,369 | 6,923 | 19,644 | |
Single Male w/Child | 523 | 864 | 1,756 | |
Single Female w/Child | 1,143 | 1,942 | 4,622 |
Population Change Last Two Decades - Plus Projection
2000 | % | 2010 | % | 2020 | % | 2030 | |
---|---|---|---|---|---|---|---|
Texas | 20,851,820 | +21 | 25,145,561 | +18 | 29,677,668 | +18 | 34,894,452 |
Dallas County | 2,218,899 | +7 | 2,368,139 | +15 | 2,734,111 | +14 | 3,106,298 |
Total Working Age Population:
Total Households:
Total Working Age Population:
Total Households:
Total Working Age Population:
Total Households: