Industrial Properties
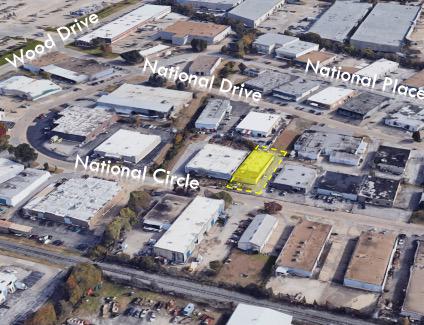
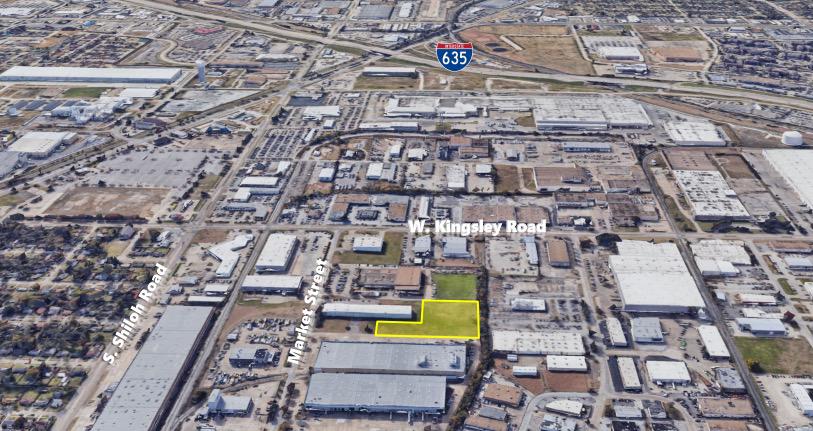
2702 National Cir Garland, TX 75041
2702 National Cir Garland, TX 75041
Details & Description
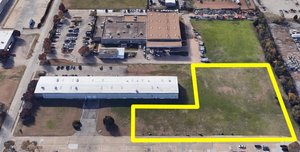
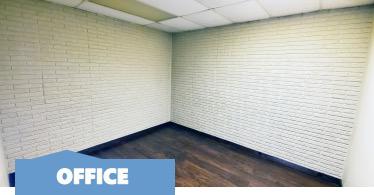
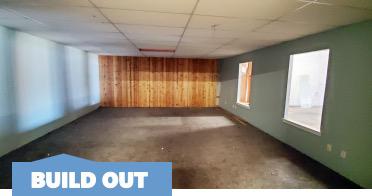
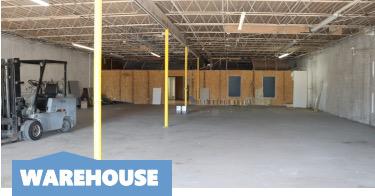
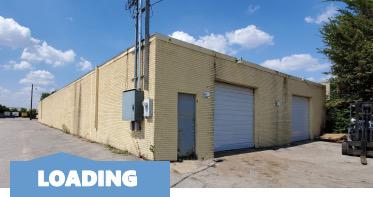
Additional Photos
Listing Agents

Tucker Cason
M: 214-802-0940
tcason@mercer-company.com
M: 214-802-0940
tcason@mercer-company.com
While we strive to provide the most accurate information, all listing information, and demographic data, is provided by third-parties. As such, MyEListing will not be responsible for the accuracy of the information. It is strongly recommended that you verify all information with the listing agent, and any relevant agencies, prior to making any decisions.