Industrial Properties
4309 Action Street Garland, TX 75042
4309 Action Street Garland, TX 75042

Details & Description
Property Highlights
- • Approx 7,692 SF on 0.4174 AC
- • City of Garland - Industrial Zoning
- • Excellent for investment or owner-user
- • Partially tenanted, value-add opportunity
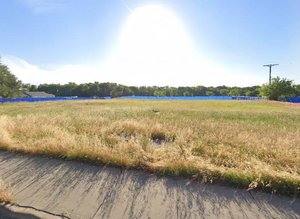
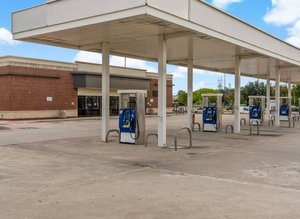
Additional Photos


Listing Agents

Angela Harwell
O: 214-433-6063
a.harwell@orioncrg.com
O: 214-433-6063
a.harwell@orioncrg.com
While we strive to provide the most accurate information, all listing information, and demographic data, is provided by third-parties. As such, MyEListing will not be responsible for the accuracy of the information. It is strongly recommended that you verify all information with the listing agent, and any relevant agencies, prior to making any decisions.