Office Space
4851 Lyndon B Johnson Freeway Farmers Branch, TX 75244
4851 Lyndon B Johnson Freeway Farmers Branch, TX 75244

Details & Description
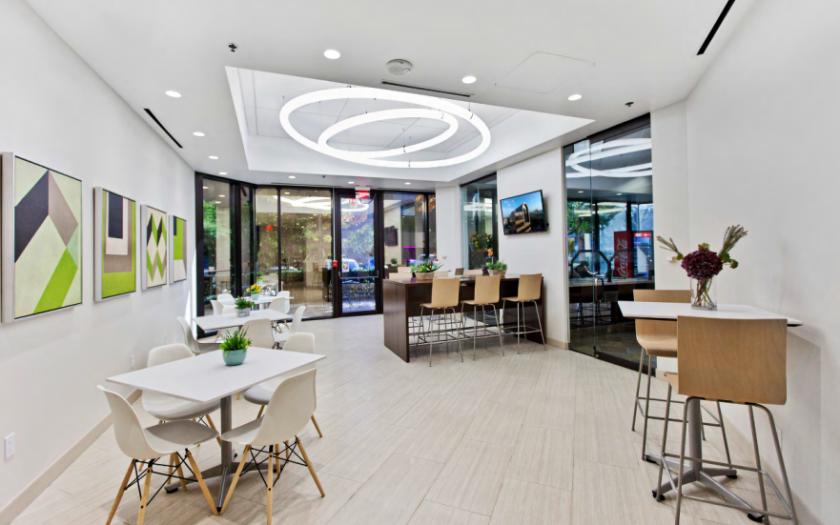
Property Highlights
- • CHEF FEATURED CAFE & LOUNGE
- • FITNESS CENTER
- • CONFERENCE CENTER
- • 24/7 Manned Security
- • On-Site Property Management
- • Full Time Engineer & Day Porter
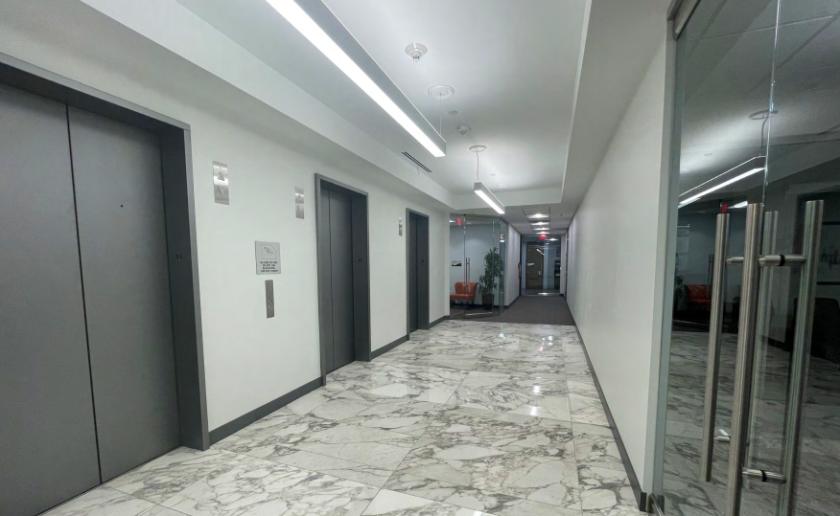
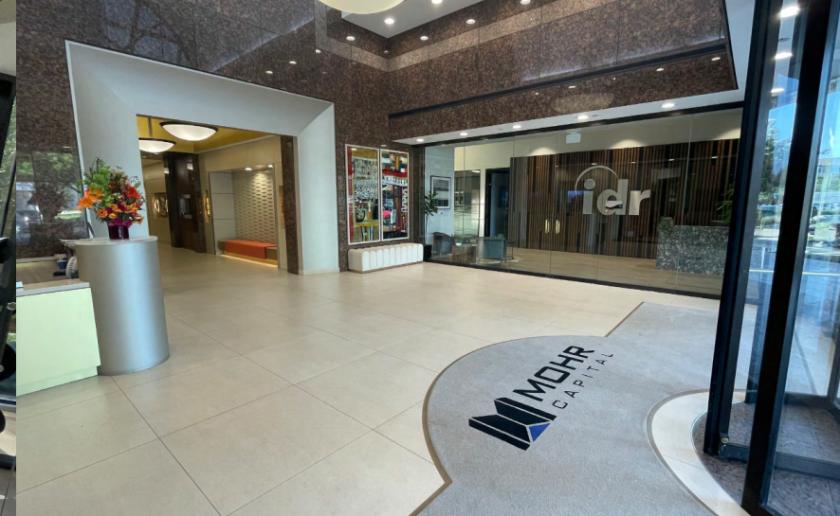
Additional Photos


Listing Agents

James Davis
O: 214-256-7103
M: 214-435-3382
jdavis@nairl.com
O: 214-256-7103
M: 214-435-3382
jdavis@nairl.com

Grant Frerichs
O: 214-256-7146
M: 214-601-0722
gfrerichs@nairl.com
O: 214-256-7146
M: 214-601-0722
gfrerichs@nairl.com
While we strive to provide the most accurate information, all listing information, and demographic data, is provided by third-parties. As such, MyEListing will not be responsible for the accuracy of the information. It is strongly recommended that you verify all information with the listing agent, and any relevant agencies, prior to making any decisions.