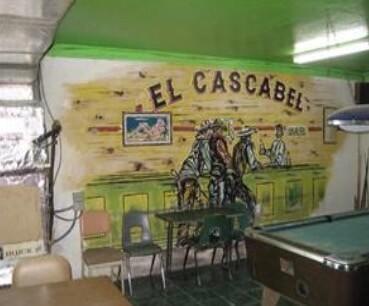
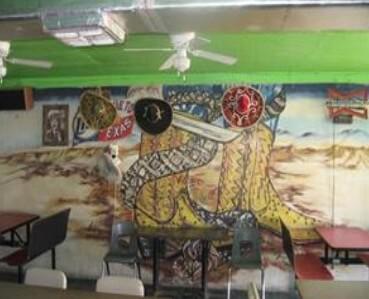
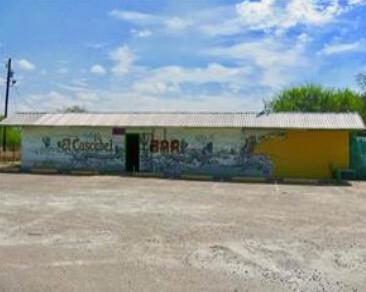
List Price: $139,000MLS Number: 213775Sq Ft Total: 2184Acreage: 5.37000Baths Full: Baths Half: Baths Total: Property Sub Type: CommercialProperty Type: CommercialEst Sq Ft: 2184Lot Sq Ft: 233917Office Sq Ft: 0Other Bldg Sq Ft: 0Retail Sq Ft: 2184Unit Sq Ft: Warehouse Sq Ft: 0Street Dir Prefix: NStreet Number: 0Street Name: AbramStreet Suffix: RoadSubdivision: KoehnStories: 1.00City: Citrus CityCounty: HidalgoEnergy Features: OtherEst Year Built: 1996Exterior Siding: Concrete Block, StuccoFlooring Type: TileGarage Carport: Garage Spaces: 0.00Grounds: OtherHVAC: Central, ElectricParking: PavedPostal Code: 78576Potential Lease Type: Present Use: Bar/TavernPresently Leased YN: YesRoof: MetalSite Features: Restrooms-Private, Security Lighting, Security SystemState: TexasSuitable Use: Units Total: Utilities: 110VACUnit Count: Unit Number: Virtual Tour URL: Water Comments: Water Heater: NoneWater Sewer: Zoning: B2Improvements: Maintenance Expense: Topography Description: Public Remarks: The property is about 5.37 net acres as per HCAD and has a stuccoed block building in the middle surrounded by a stuccoed block fence. It's out in the country, but there are local neighborhoods in the area. Floors are tiled. Interior of the building is rustic with drawings of a rattlesnake and Mexican revolutionaries on walls. plywood ceilings, stucco pillars indoors, stuccoed walls and burglar bars. It's built like a fortress with stucco fence in front with gate. It was custom-built by owner. Building has a lot of potential for other type of retail businesses, restaurant, child's daycare center if appropriately adapted and the like. It is located out in the county.