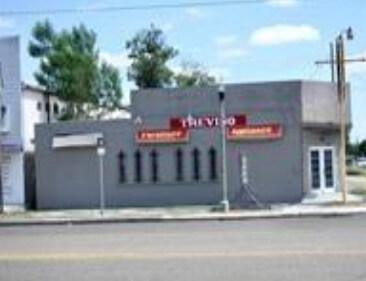
1-Mile | 3-Miles | 5-Miles | ||
---|---|---|---|---|
Total Population | 13,949 | 92,540 | 213,200 | |
Population Median Age | 36 | 34 | 34 | |
Population by Age | 0-9 Yrs | 2293 (16%) | 16789 (18%) | 37362 (17%) |
10-19 Yrs | 2123 (15%) | 14894 (16%) | 34229 (16%) | |
20-29 Yrs | 1869 (13%) | 13954 (15%) | 31524 (14%) | |
30-39 Yrs | 1618 (11%) | 11546 (12%) | 27674 (12%) | |
40-49 Yrs | 1637 (11%) | 10492 (11%) | 25314 (11%) | |
50-59 Yrs | 1607 (11%) | 9247 (9%) | 20143 (9%) | |
60-69 Yrs | 1140 (8%) | 7102 (7%) | 17052 (7%) | |
70+ Yrs | 1662 (11%) | 8516 (9%) | 19903 (9%) | |
Median HH Income | $31,123 | $40,239 | $39,034 | |
Total Household Income | < 24K | 1814 (43%) | 9087 (33%) | 22374 (34%) |
25-49K | 1137 (27%) | 7236 (26%) | 15912 (24%) | |
50-74K | 562 (13%) | 4515 (16%) | 10252 (15%) | |
75-99K | 220 (5%) | 2629 (9%) | 6357 (9%) | |
100-199K | 398 (9%) | 3296 (12%) | 7855 (12%) | |
200K+ | 52 (1%) | 546 (1%) | 1671 (2%) | |
Highest Education Level | No Diploma | 3869 | 17807 | 42031 |
Diploma or GED | 2199 | 12868 | 28338 | |
Some College | 1472 | 10763 | 23374 | |
Assoc. Degree | 268 | 2566 | 5838 | |
Bachelors Degree | 679 | 7684 | 18822 | |
Higher Degree | 215 | 2801 | 7870 | |
Total Housing Units | 4,795 | 31,603 | 74,450 | |
--Owner-Occupied | 2,508 | 16,485 | 38,892 | |
--Renter-Occupied | 1,675 | 10,824 | 25,528 | |
Owner-Occupied Values | < 100K | 1945 | 10092 | 22316 |
100-199K | 458 | 5094 | 12108 | |
200-299K | 65 | 719 | 2596 | |
300-399K | 12 | 309 | 1000 | |
400-499K | 0 | 126 | 401 | |
500K+ | 29 | 146 | 471 | |
Total Working Age Population | 10,201 | 66,095 | 154,075 | |
In Work Force | 5,282 | 38,431 | 89,379 | |
Not In Work Force | 4,919 | 27,664 | 64,696 | |
Workforce Employed | 4,845 | 35,896 | 83,453 | |
Workforce Unemployed | 438 | 2,535 | 5,924 | |
Civlian Workforce | 5,282 | 38,431 | 89,377 | |
Military Workforce | 0 | 0 | 1 | |
Total Households | 4,183 | 27,309 | 64,420 | |
Family Households | 3,131 | 21,586 | 50,249 | |
Non-Family Households | 1,052 | 5,724 | 14,171 | |
Married Couple | 1,703 | 13,368 | 31,943 | |
Other Family | 1,428 | 8,217 | 18,306 | |
Married w/Child | 820 | 6,469 | 15,238 | |
Single Male w/Child | 58 | 296 | 1,060 | |
Single Female w/Child | 491 | 3,807 | 8,048 |
Population Change Last Two Decades - Plus Projection
2000 | % | 2010 | % | 2020 | % | 2030 | |
---|---|---|---|---|---|---|---|
Texas | 20,851,820 | +21 | 25,145,561 | +18 | 29,677,668 | +18 | 34,894,452 |
Hidalgo County | 569,463 | +36 | 774,769 | +12 | 870,366 | +10 | 956,044 |
Total Working Age Population:
Total Households:
Total Working Age Population:
Total Households:
Total Working Age Population:
Total Households: