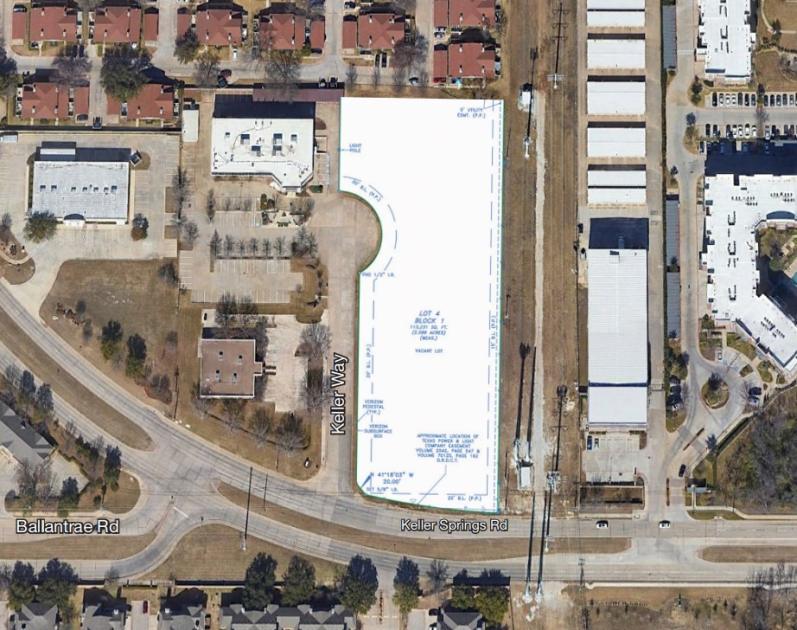
1-Mile | 3-Miles | 5-Miles | ||
---|---|---|---|---|
Total Population | 11,578 | 164,260 | 368,654 | |
Population Median Age | 41 | 37 | 38 | |
Population by Age | 0-9 Yrs | 1230 (10%) | 18252 (11%) | 42580 (11%) |
10-19 Yrs | 743 (6%) | 14923 (9%) | 40135 (10%) | |
20-29 Yrs | 1557 (13%) | 31161 (18%) | 58859 (15%) | |
30-39 Yrs | 2245 (19%) | 32807 (19%) | 61635 (16%) | |
40-49 Yrs | 1597 (13%) | 21588 (13%) | 50267 (13%) | |
50-59 Yrs | 1458 (12%) | 18141 (11%) | 46534 (12%) | |
60-69 Yrs | 1456 (12%) | 15090 (9%) | 36928 (10%) | |
70+ Yrs | 1291 (11%) | 12297 (7%) | 31718 (8%) | |
Median HH Income | $62,044 | $66,613 | $72,318 | |
Total Household Income | < 24K | 945 (16%) | 8939 (11%) | 18171 (11%) |
25-49K | 1310 (22%) | 18040 (23%) | 32954 (21%) | |
50-74K | 1165 (20%) | 15954 (21%) | 29092 (18%) | |
75-99K | 787 (13%) | 11289 (14%) | 19994 (12%) | |
100-199K | 1098 (18%) | 15649 (20%) | 36611 (23%) | |
200K+ | 509 (8%) | 5683 (7%) | 17554 (11%) | |
Highest Education Level | No Diploma | 700 | 11364 | 27103 |
Diploma or GED | 1709 | 21173 | 43618 | |
Some College | 2002 | 26081 | 50918 | |
Assoc. Degree | 796 | 7959 | 15628 | |
Bachelors Degree | 2647 | 36011 | 80707 | |
Higher Degree | 1141 | 17811 | 44797 | |
Total Housing Units | 6,214 | 83,224 | 169,735 | |
--Owner-Occupied | 2,304 | 25,272 | 70,671 | |
--Renter-Occupied | 3,510 | 50,282 | 83,705 | |
Owner-Occupied Values | < 100K | 87 | 938 | 2208 |
100-199K | 464 | 7176 | 13793 | |
200-299K | 673 | 6676 | 17175 | |
300-399K | 827 | 5291 | 14368 | |
400-499K | 85 | 1773 | 8300 | |
500K+ | 169 | 3417 | 14827 | |
Total Working Age Population | 9,824 | 136,763 | 301,489 | |
In Work Force | 7,381 | 106,433 | 224,067 | |
Not In Work Force | 2,443 | 30,330 | 77,422 | |
Workforce Employed | 7,017 | 101,917 | 215,024 | |
Workforce Unemployed | 364 | 4,360 | 8,835 | |
Civlian Workforce | 7,381 | 106,276 | 223,859 | |
Military Workforce | 0 | 157 | 208 | |
Total Households | 5,814 | 75,553 | 154,376 | |
Family Households | 2,785 | 37,728 | 89,313 | |
Non-Family Households | 3,029 | 37,826 | 65,063 | |
Married Couple | 2,117 | 26,271 | 66,344 | |
Other Family | 668 | 11,456 | 22,969 | |
Married w/Child | 916 | 10,200 | 27,068 | |
Single Male w/Child | 35 | 1,282 | 2,679 | |
Single Female w/Child | 260 | 4,812 | 9,366 |
Population Change Last Two Decades - Plus Projection
2000 | % | 2010 | % | 2020 | % | 2030 | |
---|---|---|---|---|---|---|---|
Texas | 20,851,820 | +21 | 25,145,561 | +18 | 29,677,668 | +18 | 34,894,452 |
Denton County | 432,976 | +53 | 662,614 | +36 | 897,953 | +37 | 1,234,110 |
Collin County | 491,675 | +59 | 782,341 | +33 | 1,039,369 | +34 | 1,391,461 |
Dallas County | 2,218,899 | +7 | 2,368,139 | +15 | 2,734,111 | +14 | 3,106,298 |
Total Working Age Population:
Total Households:
Total Working Age Population:
Total Households:
Total Working Age Population:
Total Households: