Commercial Land
West North Street near Hickory St Akron, OH 44304
West North Street near Hickory St Akron, OH 44304
Details & Description
Property Highlights
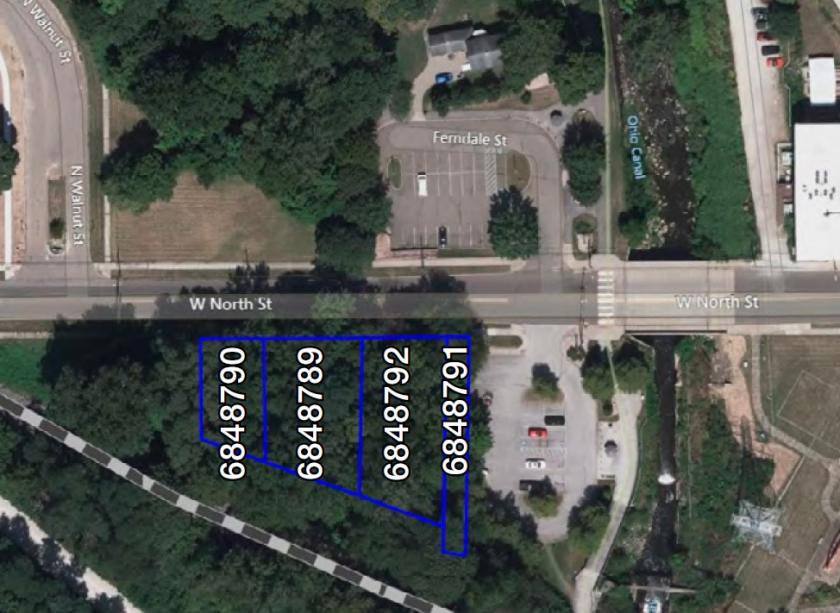
- • 4 Parcels Available for Development
- • Zone U-1
- • Close to Lock 15 and the Towpath
Listing Agents

David Whyte
O: 330-535-2661
M: 303-352-7746
dwhyte@naipvc.com
O: 330-535-2661
M: 303-352-7746
dwhyte@naipvc.com

Karen Whyte
O: 330-535-2661
M: 330-351-1757
karen.whyte@naipvc.com
O: 330-535-2661
M: 330-351-1757
karen.whyte@naipvc.com
While we strive to provide the most accurate information, all listing information, and demographic data, is provided by third-parties. As such, MyEListing will not be responsible for the accuracy of the information. It is strongly recommended that you verify all information with the listing agent, and any relevant agencies, prior to making any decisions.


