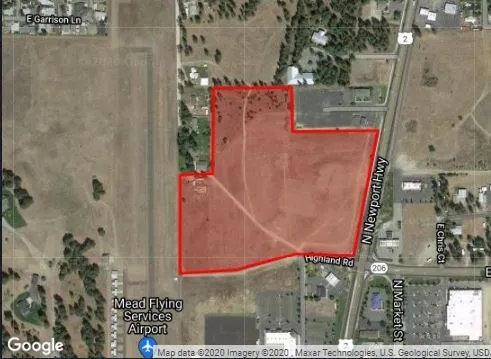
1-Mile | 3-Miles | 5-Miles | ||
---|---|---|---|---|
Total Population | 3,012 | 23,031 | 54,184 | |
Population Median Age | 39 | 40 | 39 | |
Population by Age | 0-9 Yrs | 375 (12%) | 2687 (11%) | 6268 (11%) |
10-19 Yrs | 540 (17%) | 3944 (17%) | 8991 (16%) | |
20-29 Yrs | 204 (6%) | 2135 (9%) | 6130 (11%) | |
30-39 Yrs | 333 (11%) | 2558 (11%) | 6578 (12%) | |
40-49 Yrs | 426 (14%) | 3053 (13%) | 6585 (12%) | |
50-59 Yrs | 403 (13%) | 3140 (13%) | 6727 (12%) | |
60-69 Yrs | 398 (13%) | 2694 (11%) | 6316 (11%) | |
70+ Yrs | 332 (11%) | 2822 (12%) | 6589 (12%) | |
Median HH Income | $69,947 | $82,633 | $76,039 | |
Total Household Income | < 24K | 116 (10%) | 792 (9%) | 2402 (11%) |
25-49K | 249 (22%) | 1746 (20%) | 4361 (21%) | |
50-74K | 256 (22%) | 1432 (16%) | 3316 (16%) | |
75-99K | 157 (13%) | 1085 (12%) | 2694 (13%) | |
100-199K | 298 (26%) | 2611 (30%) | 5597 (27%) | |
200K+ | 46 (4%) | 937 (10%) | 2011 (9%) | |
Highest Education Level | No Diploma | 172 | 781 | 1794 |
Diploma or GED | 469 | 3180 | 7781 | |
Some College | 637 | 4140 | 9782 | |
Assoc. Degree | 230 | 1999 | 4399 | |
Bachelors Degree | 357 | 3108 | 7296 | |
Higher Degree | 151 | 1918 | 4239 | |
Total Housing Units | 1,197 | 8,995 | 21,136 | |
--Owner-Occupied | 948 | 6,113 | 13,149 | |
--Renter-Occupied | 176 | 2,491 | 7,233 | |
Owner-Occupied Values | < 100K | 261 | 492 | 823 |
100-199K | 63 | 179 | 603 | |
200-299K | 138 | 899 | 2541 | |
300-399K | 175 | 1526 | 3521 | |
400-499K | 202 | 1560 | 2685 | |
500K+ | 108 | 1457 | 2976 | |
Total Working Age Population | 2,358 | 18,059 | 43,178 | |
In Work Force | 1,353 | 10,961 | 26,265 | |
Not In Work Force | 1,006 | 7,098 | 16,913 | |
Workforce Employed | 1,225 | 10,455 | 24,968 | |
Workforce Unemployed | 128 | 465 | 1,235 | |
Civlian Workforce | 1,353 | 10,920 | 26,203 | |
Military Workforce | 0 | 41 | 61 | |
Total Households | 1,123 | 8,603 | 20,382 | |
Family Households | 836 | 6,503 | 13,822 | |
Non-Family Households | 288 | 2,100 | 6,560 | |
Married Couple | 611 | 5,217 | 10,978 | |
Other Family | 225 | 1,286 | 2,844 | |
Married w/Child | 271 | 2,220 | 4,510 | |
Single Male w/Child | 71 | 230 | 448 | |
Single Female w/Child | 84 | 586 | 1,251 |
Population Change Last Two Decades - Plus Projection
2000 | % | 2010 | % | 2020 | % | 2030 | |
---|---|---|---|---|---|---|---|
Washington | 5,894,121 | +14 | 6,724,540 | +15 | 7,705,281 | +10 | 8,502,764 |
Spokane County | 417,939 | +13 | 471,221 | +14 | 539,339 | +9 | 587,377 |
Total Working Age Population:
Total Households:
Total Working Age Population:
Total Households:
Total Working Age Population:
Total Households: