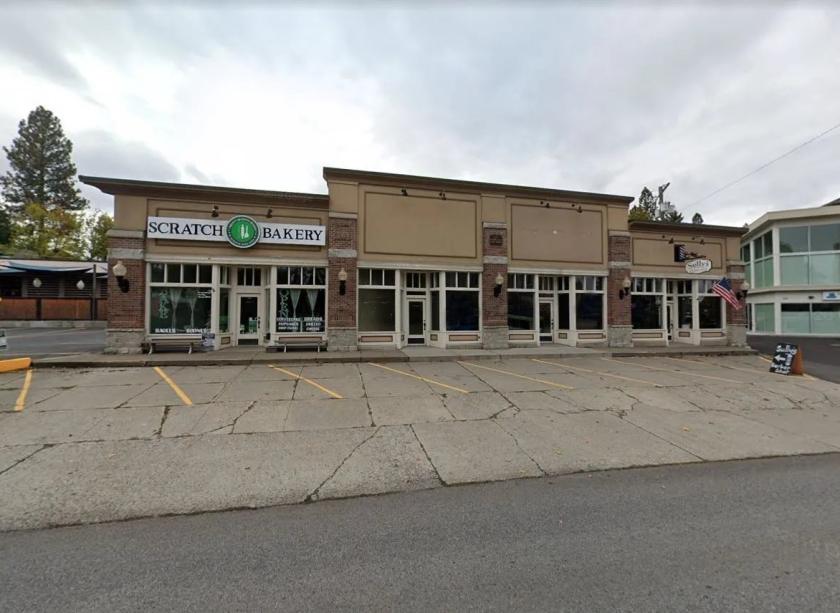
1-Mile | 3-Miles | 5-Miles | ||
---|---|---|---|---|
Total Population | 15,849 | 104,813 | 204,318 | |
Population Median Age | 41 | 40 | 39 | |
Population by Age | 0-9 Yrs | 1311 (8%) | 9896 (9%) | 22926 (11%) |
10-19 Yrs | 1285 (8%) | 10798 (10%) | 22814 (11%) | |
20-29 Yrs | 2772 (17%) | 20072 (19%) | 34778 (17%) | |
30-39 Yrs | 2647 (16%) | 16066 (15%) | 31632 (15%) | |
40-49 Yrs | 1813 (11%) | 12015 (11%) | 24243 (11%) | |
50-59 Yrs | 2310 (14%) | 12270 (11%) | 23433 (11%) | |
60-69 Yrs | 1975 (12%) | 11863 (11%) | 23356 (11%) | |
70+ Yrs | 1735 (10%) | 11833 (11%) | 21135 (10%) | |
Median HH Income | $61,582 | $61,283 | $63,044 | |
Total Household Income | < 24K | 1633 (21%) | 9946 (21%) | 16769 (19%) |
25-49K | 1615 (21%) | 9265 (20%) | 17673 (20%) | |
50-74K | 1334 (17%) | 8301 (18%) | 15906 (18%) | |
75-99K | 873 (11%) | 5332 (11%) | 10861 (12%) | |
100-199K | 1644 (21%) | 9750 (21%) | 19062 (22%) | |
200K+ | 561 (7%) | 3419 (7%) | 5908 (6%) | |
Highest Education Level | No Diploma | 433 | 4414 | 9458 |
Diploma or GED | 2086 | 14954 | 32299 | |
Some College | 2911 | 17895 | 35376 | |
Assoc. Degree | 1099 | 8290 | 17388 | |
Bachelors Degree | 3146 | 17522 | 30433 | |
Higher Degree | 2595 | 11299 | 18110 | |
Total Housing Units | 8,411 | 49,085 | 90,850 | |
--Owner-Occupied | 3,668 | 23,694 | 49,520 | |
--Renter-Occupied | 3,993 | 22,320 | 36,658 | |
Owner-Occupied Values | < 100K | 162 | 1446 | 2770 |
100-199K | 367 | 3923 | 10082 | |
200-299K | 727 | 5891 | 14237 | |
300-399K | 768 | 4799 | 9190 | |
400-499K | 785 | 3300 | 5802 | |
500K+ | 859 | 4335 | 7438 | |
Total Working Age Population | 13,775 | 89,106 | 167,418 | |
In Work Force | 8,635 | 54,474 | 104,933 | |
Not In Work Force | 5,140 | 34,632 | 62,484 | |
Workforce Employed | 7,897 | 50,530 | 97,465 | |
Workforce Unemployed | 676 | 3,532 | 6,703 | |
Civlian Workforce | 8,573 | 54,062 | 104,168 | |
Military Workforce | 62 | 411 | 765 | |
Total Households | 7,660 | 46,013 | 86,178 | |
Family Households | 3,401 | 22,343 | 46,338 | |
Non-Family Households | 4,259 | 23,671 | 39,841 | |
Married Couple | 2,440 | 15,608 | 32,303 | |
Other Family | 961 | 6,734 | 14,035 | |
Married w/Child | 812 | 5,492 | 12,443 | |
Single Male w/Child | 86 | 1,007 | 2,551 | |
Single Female w/Child | 395 | 2,497 | 4,965 |
Population Change Last Two Decades - Plus Projection
2000 | % | 2010 | % | 2020 | % | 2030 | |
---|---|---|---|---|---|---|---|
Washington | 5,894,121 | +14 | 6,724,540 | +15 | 7,705,281 | +10 | 8,502,764 |
Spokane County | 417,939 | +13 | 471,221 | +14 | 539,339 | +9 | 587,377 |
Total Working Age Population:
Total Households:
Total Working Age Population:
Total Households:
Total Working Age Population:
Total Households: