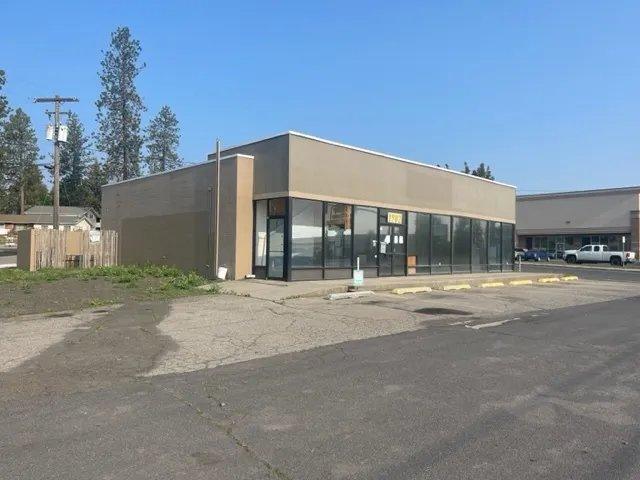
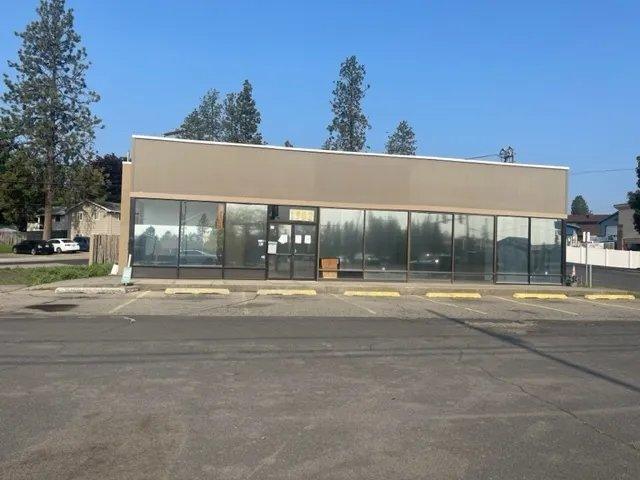
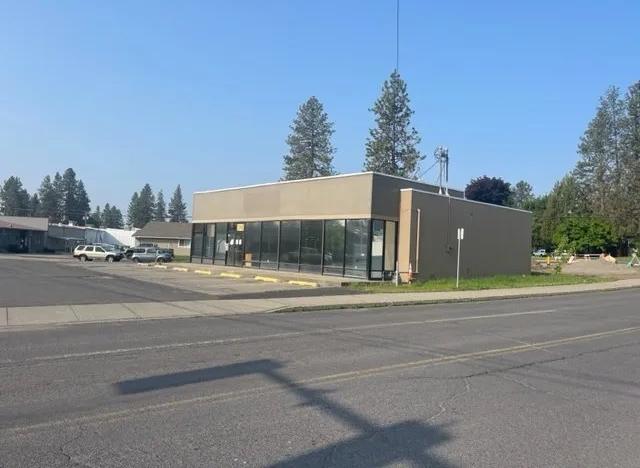
1-Mile | 3-Miles | 5-Miles | ||
---|---|---|---|---|
Total Population | 8,273 | 12,558 | 15,183 | |
Population Median Age | 31 | 32 | 34 | |
Population by Age | 0-9 Yrs | 661 (7%) | 921 (7%) | 1259 (8%) |
10-19 Yrs | 1710 (20%) | 2467 (19%) | 2708 (17%) | |
20-29 Yrs | 3015 (36%) | 4418 (35%) | 4719 (31%) | |
30-39 Yrs | 886 (10%) | 1308 (10%) | 1608 (10%) | |
40-49 Yrs | 410 (4%) | 754 (6%) | 1115 (7%) | |
50-59 Yrs | 505 (6%) | 796 (6%) | 1030 (6%) | |
60-69 Yrs | 505 (6%) | 950 (7%) | 1423 (9%) | |
70+ Yrs | 581 (7%) | 944 (7%) | 1321 (8%) | |
Median HH Income | $45,419 | $46,339 | $53,189 | |
Total Household Income | < 24K | 1031 (35%) | 1606 (33%) | 1714 (29%) |
25-49K | 524 (17%) | 978 (20%) | 1073 (18%) | |
50-74K | 403 (13%) | 634 (13%) | 819 (14%) | |
75-99K | 319 (10%) | 526 (10%) | 716 (12%) | |
100-199K | 435 (14%) | 679 (14%) | 942 (16%) | |
200K+ | 220 (7%) | 374 (7%) | 488 (8%) | |
Highest Education Level | No Diploma | 316 | 437 | 599 |
Diploma or GED | 667 | 941 | 1184 | |
Some College | 672 | 1417 | 2046 | |
Assoc. Degree | 437 | 684 | 911 | |
Bachelors Degree | 989 | 1491 | 1865 | |
Higher Degree | 508 | 966 | 1223 | |
Total Housing Units | 3,171 | 5,095 | 6,104 | |
--Owner-Occupied | 1,007 | 1,815 | 2,653 | |
--Renter-Occupied | 1,924 | 2,981 | 3,100 | |
Owner-Occupied Values | < 100K | 89 | 129 | 160 |
100-199K | 90 | 150 | 234 | |
200-299K | 337 | 652 | 807 | |
300-399K | 187 | 359 | 570 | |
400-499K | 116 | 211 | 303 | |
500K+ | 189 | 314 | 579 | |
Total Working Age Population | 7,161 | 10,861 | 12,992 | |
In Work Force | 4,676 | 7,164 | 8,378 | |
Not In Work Force | 2,486 | 3,697 | 4,614 | |
Workforce Employed | 3,870 | 6,030 | 7,169 | |
Workforce Unemployed | 712 | 934 | 968 | |
Civlian Workforce | 4,582 | 6,964 | 8,137 | |
Military Workforce | 94 | 200 | 242 | |
Total Households | 2,931 | 4,797 | 5,753 | |
Family Households | 1,446 | 2,304 | 3,035 | |
Non-Family Households | 1,485 | 2,492 | 2,718 | |
Married Couple | 1,010 | 1,606 | 2,173 | |
Other Family | 437 | 698 | 862 | |
Married w/Child | 411 | 607 | 809 | |
Single Male w/Child | 65 | 143 | 160 | |
Single Female w/Child | 243 | 299 | 319 |
Population Change Last Two Decades - Plus Projection
2000 | % | 2010 | % | 2020 | % | 2030 | |
---|---|---|---|---|---|---|---|
Washington | 5,894,121 | +14 | 6,724,540 | +15 | 7,705,281 | +10 | 8,502,764 |
Spokane County | 417,939 | +13 | 471,221 | +14 | 539,339 | +9 | 587,377 |
Total Working Age Population:
Total Households:
Total Working Age Population:
Total Households:
Total Working Age Population:
Total Households: