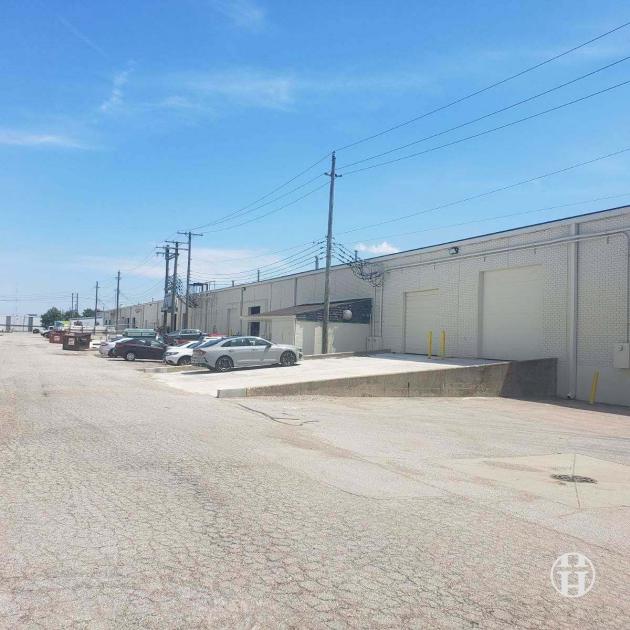
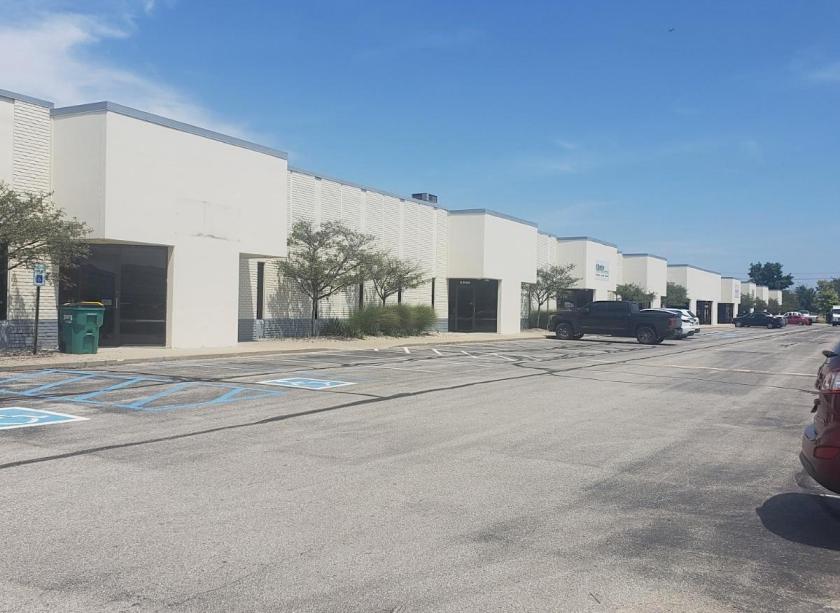
1-Mile | 3-Miles | 5-Miles | ||
---|---|---|---|---|
Total Population | 2,324 | 49,020 | 139,718 | |
Population Median Age | 37 | 38 | 37 | |
Population by Age | 0-9 Yrs | 308 (13%) | 5340 (10%) | 18739 (13%) |
10-19 Yrs | 247 (10%) | 7014 (14%) | 18982 (13%) | |
20-29 Yrs | 366 (15%) | 7367 (15%) | 19502 (13%) | |
30-39 Yrs | 429 (18%) | 6963 (14%) | 19278 (13%) | |
40-49 Yrs | 294 (12%) | 6645 (13%) | 18211 (13%) | |
50-59 Yrs | 309 (13%) | 5468 (11%) | 16852 (12%) | |
60-69 Yrs | 159 (6%) | 5079 (10%) | 14680 (10%) | |
70+ Yrs | 211 (9%) | 5143 (10%) | 13474 (9%) | |
Median HH Income | $53,433 | $65,679 | $69,106 | |
Total Household Income | < 24K | 166 (14%) | 3347 (16%) | 8918 (15%) |
25-49K | 333 (29%) | 4580 (22%) | 11321 (20%) | |
50-74K | 345 (30%) | 3665 (17%) | 10207 (18%) | |
75-99K | 160 (14%) | 2673 (12%) | 7075 (12%) | |
100-199K | 108 (9%) | 5061 (24%) | 12415 (22%) | |
200K+ | 5 (0%) | 1370 (6%) | 6333 (11%) | |
Highest Education Level | No Diploma | 170 | 2666 | 6567 |
Diploma or GED | 433 | 6416 | 17618 | |
Some College | 386 | 7129 | 18226 | |
Assoc. Degree | 106 | 3195 | 7627 | |
Bachelors Degree | 339 | 8361 | 25547 | |
Higher Degree | 116 | 5109 | 17286 | |
Total Housing Units | 1,237 | 22,254 | 60,097 | |
--Owner-Occupied | 427 | 11,138 | 32,379 | |
--Renter-Occupied | 690 | 9,558 | 23,890 | |
Owner-Occupied Values | < 100K | 95 | 842 | 2338 |
100-199K | 191 | 4740 | 10914 | |
200-299K | 117 | 3189 | 8669 | |
300-399K | 23 | 694 | 3109 | |
400-499K | 1 | 604 | 2017 | |
500K+ | 1 | 1069 | 5332 | |
Total Working Age Population | 1,977 | 39,984 | 109,272 | |
In Work Force | 1,604 | 27,337 | 74,894 | |
Not In Work Force | 373 | 12,647 | 34,378 | |
Workforce Employed | 1,526 | 26,125 | 71,122 | |
Workforce Unemployed | 78 | 1,187 | 3,715 | |
Civlian Workforce | 1,604 | 27,312 | 74,837 | |
Military Workforce | 0 | 25 | 58 | |
Total Households | 1,117 | 20,696 | 56,270 | |
Family Households | 399 | 10,851 | 32,449 | |
Non-Family Households | 718 | 9,845 | 23,821 | |
Married Couple | 292 | 7,023 | 22,009 | |
Other Family | 107 | 3,828 | 10,440 | |
Married w/Child | 119 | 2,492 | 8,822 | |
Single Male w/Child | 6 | 387 | 1,301 | |
Single Female w/Child | 57 | 1,549 | 4,408 |
Population Change Last Two Decades - Plus Projection
2000 | % | 2010 | % | 2020 | % | 2030 | |
---|---|---|---|---|---|---|---|
Indiana | 6,080,485 | +7 | 6,483,802 | +5 | 6,785,528 | +3 | 7,014,880 |
Hamilton County | 182,740 | +50 | 274,569 | +27 | 347,467 | +20 | 417,754 |
Boone County | 46,107 | +23 | 56,640 | +25 | 70,812 | +18 | 83,749 |
Marion County | 860,454 | +5 | 903,393 | +8 | 977,203 | +2 | 1,001,231 |
Hendricks County | 104,093 | +40 | 145,448 | +20 | 174,788 | +13 | 197,902 |
Total Working Age Population:
Total Households:
Total Working Age Population:
Total Households:
Total Working Age Population:
Total Households: