Commercial Land
294 Frog Pond Lane Dripping Springs, TX 78620
294 Frog Pond Lane Dripping Springs, TX 78620
Details & Description
Property Highlights
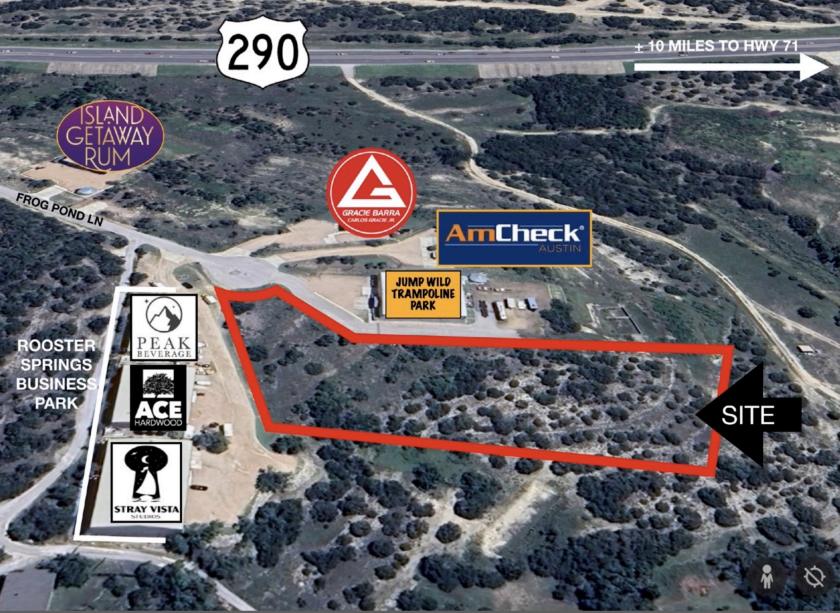
- • Great visibility from HWY 290
- • Electricity and Cable available
- • No Zoning. Dripping Springs ETJ
Listing Agents

Spencer Collins
O: 512-536-7829
M: 512-789-0909
spence@matexas.com
O: 512-536-7829
M: 512-789-0909
spence@matexas.com
While we strive to provide the most accurate information, all listing information, and demographic data, is provided by third-parties. As such, MyEListing will not be responsible for the accuracy of the information. It is strongly recommended that you verify all information with the listing agent, and any relevant agencies, prior to making any decisions.


