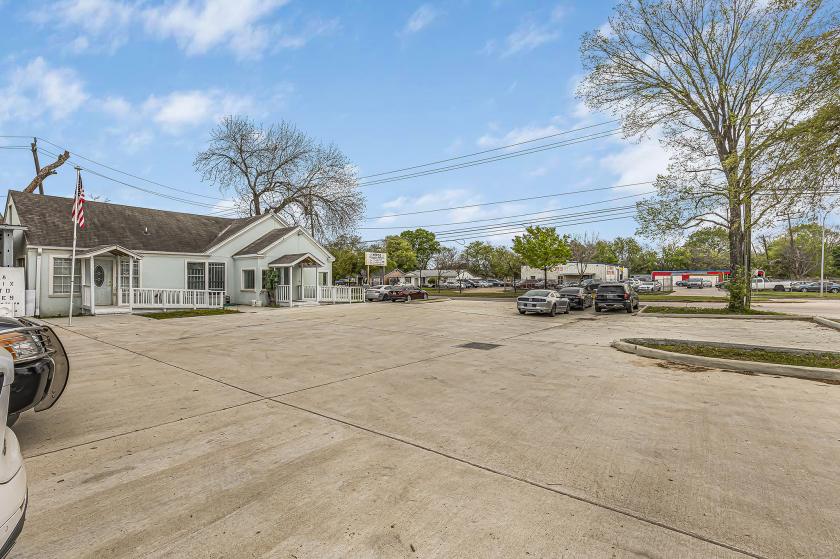
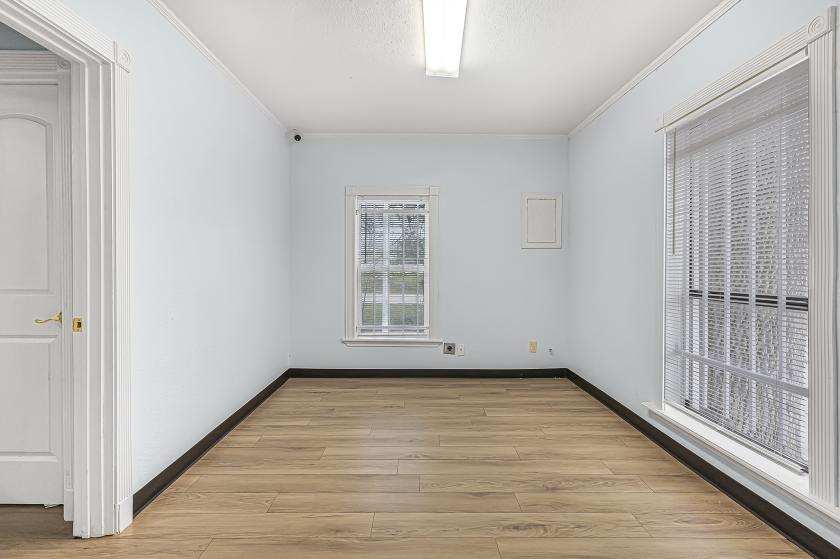
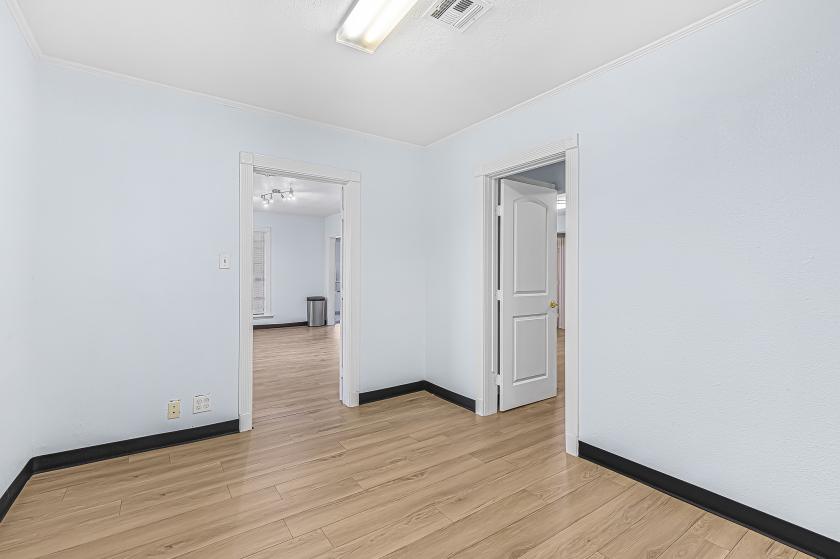
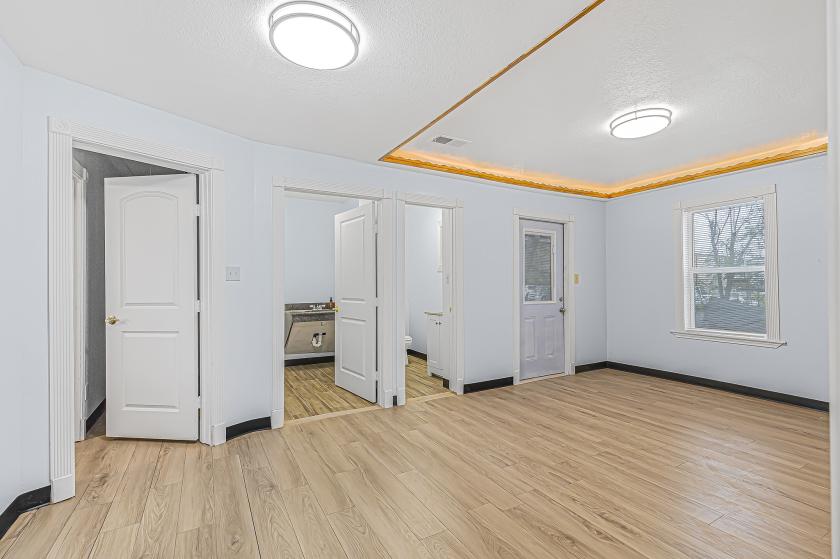
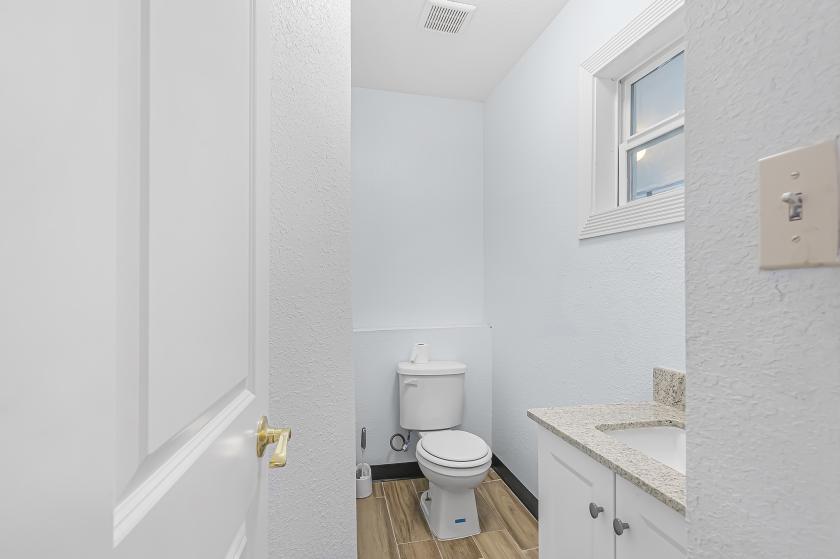
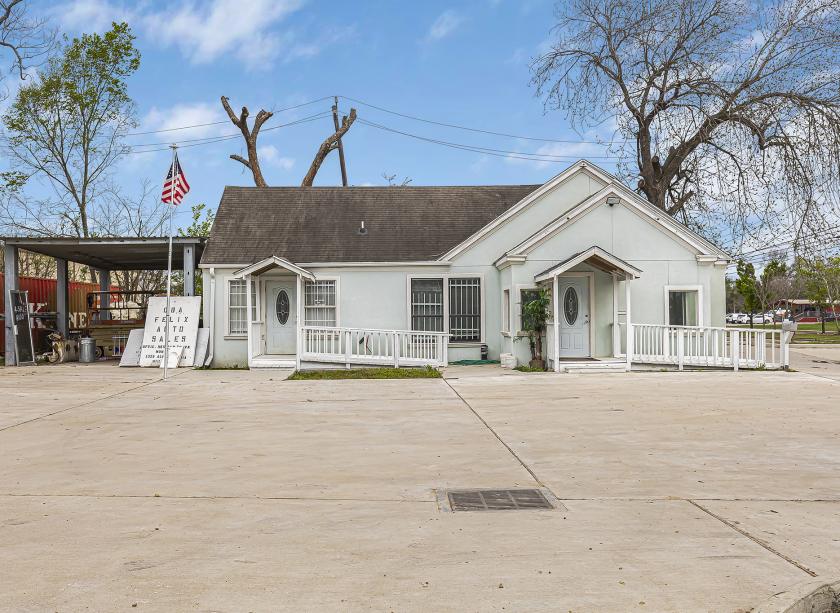
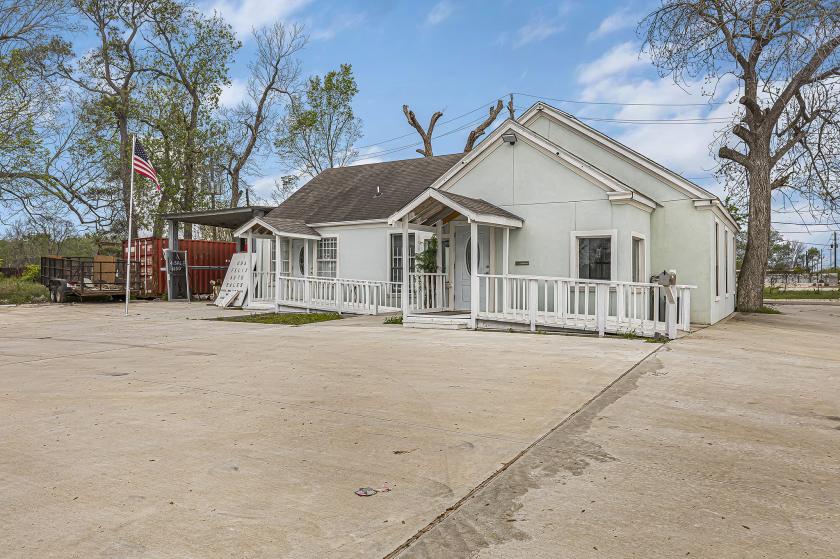
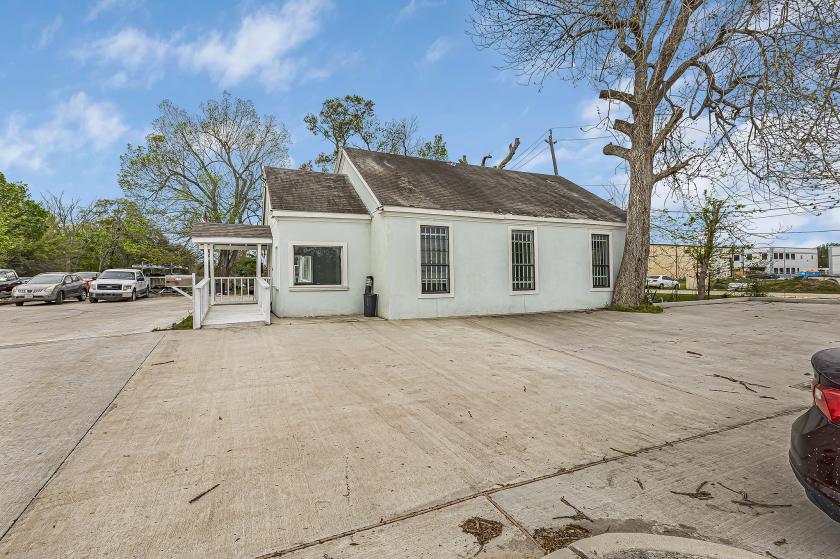
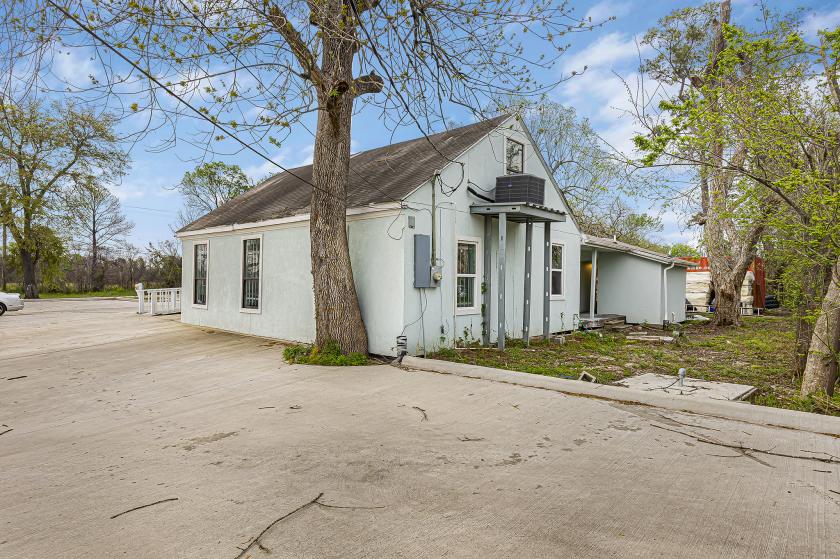
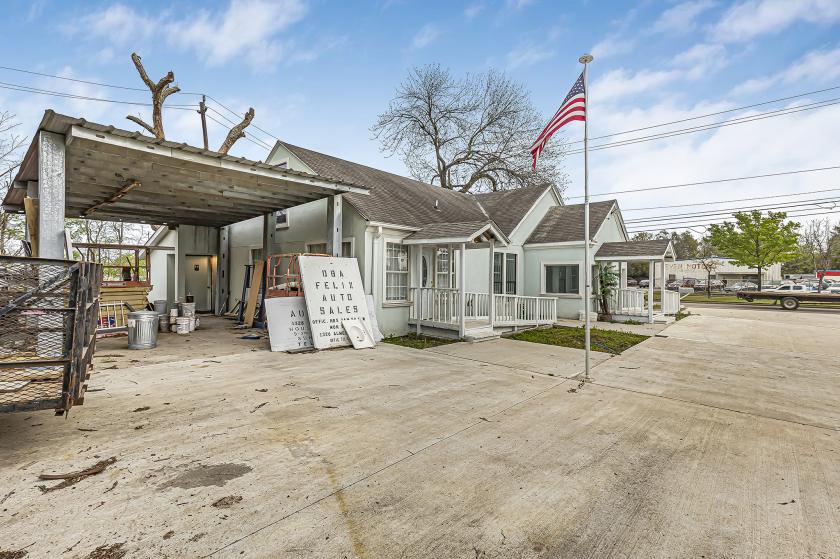
Office Space
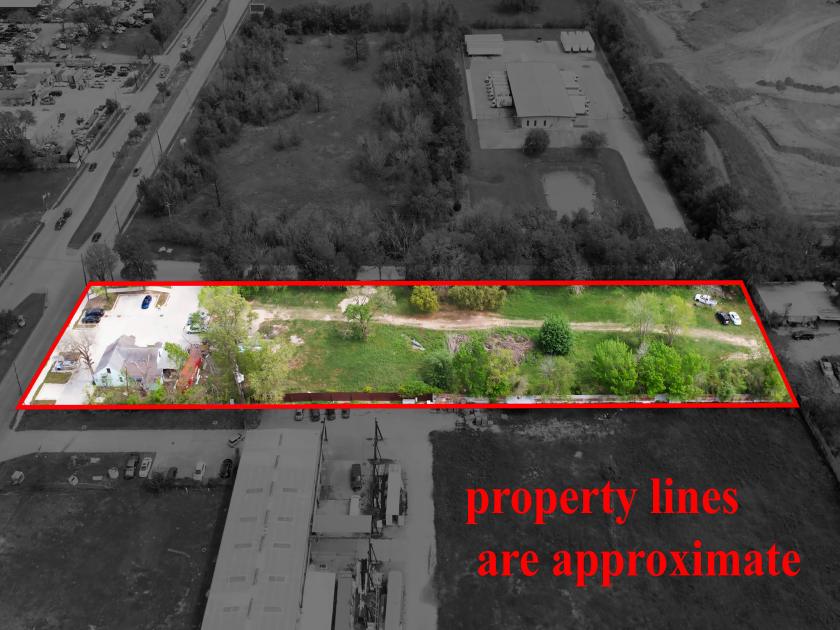
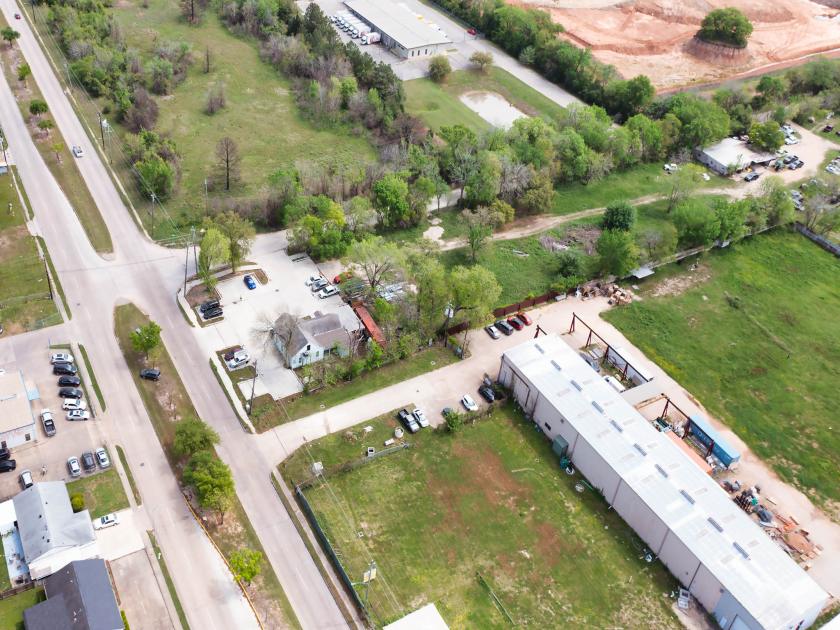
1326 Almeda-Genoa Road Houston, TX 77047
1326 Almeda-Genoa Road Houston, TX 77047
Details & Description
Property Highlights
- • Prime Location With Heavy Traffic
- • Potential For Different Use
- • Owner Operator or Investment
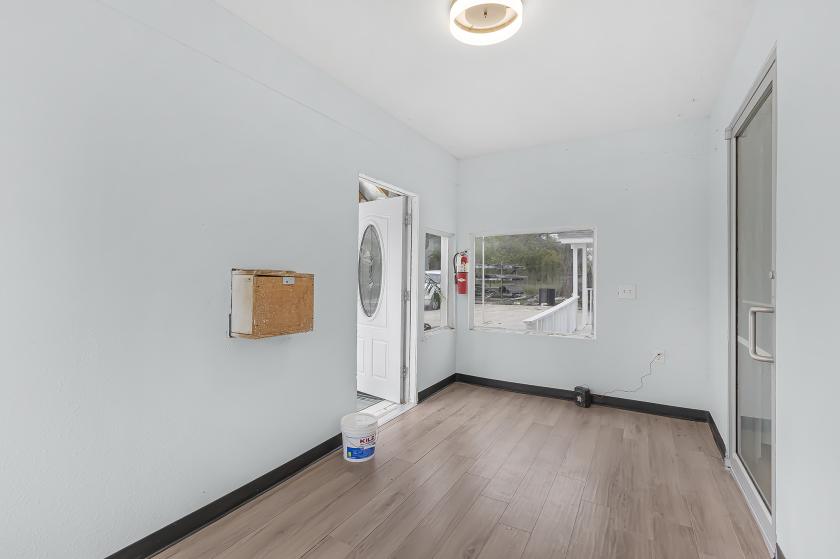
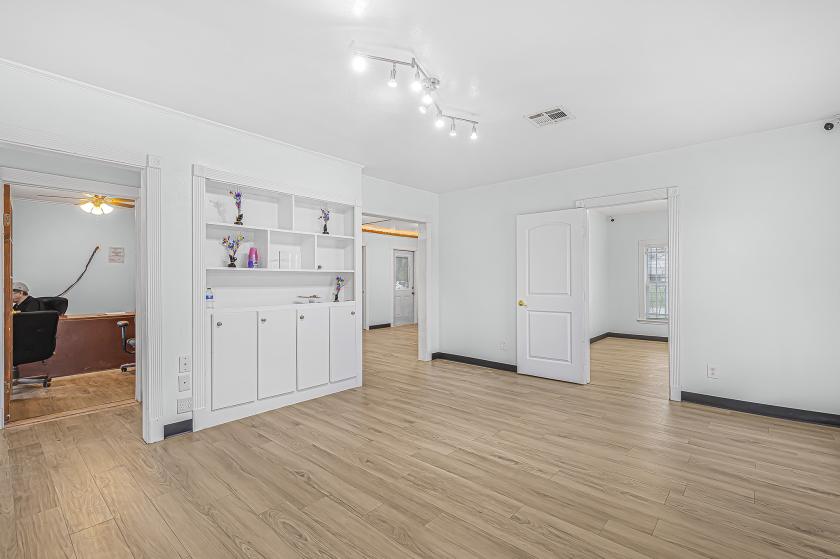
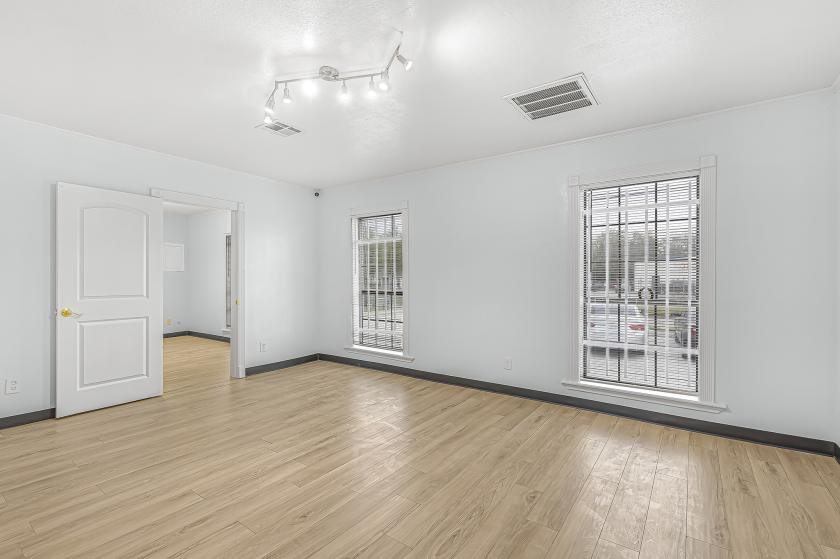
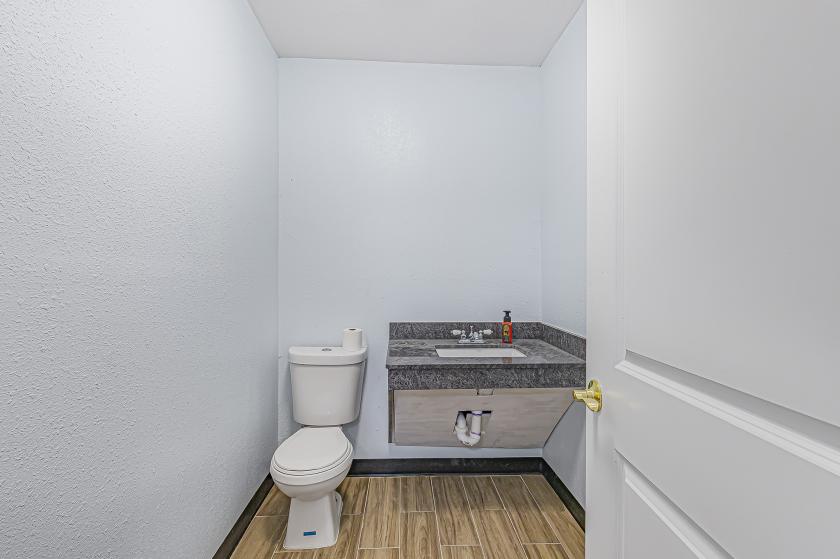
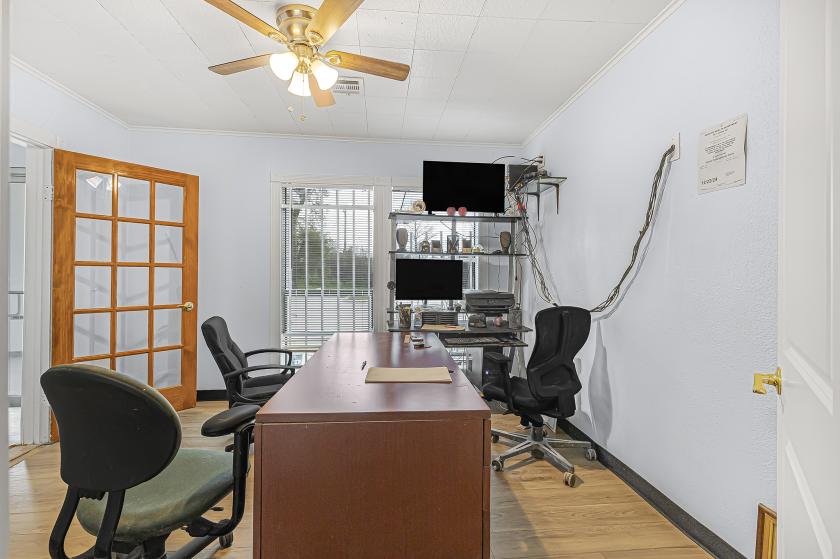
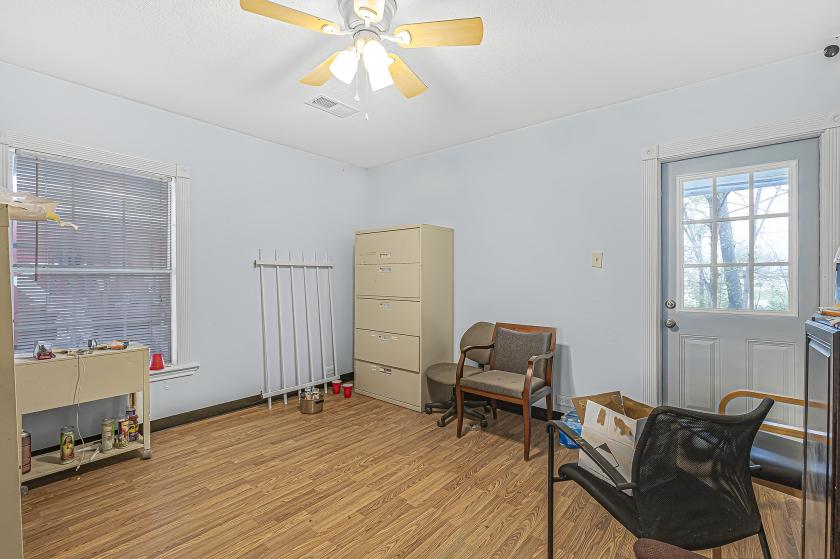
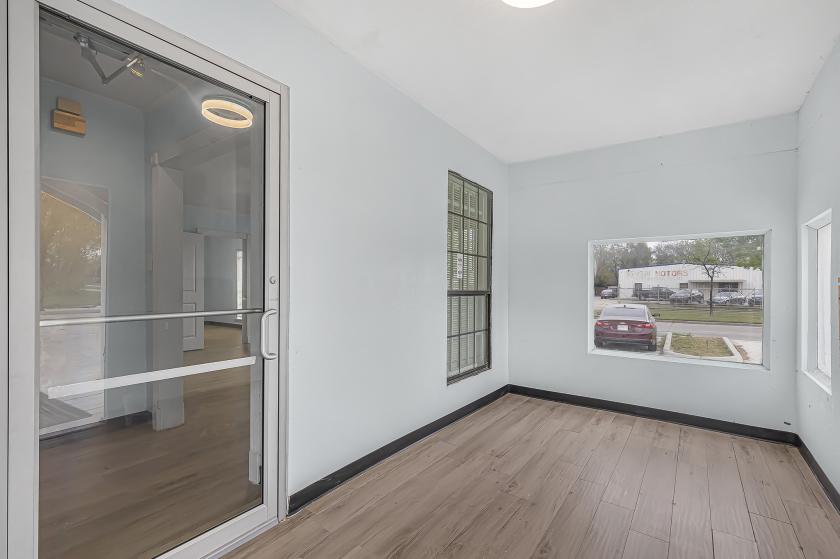
Additional Photos
Listing Agents

Mickey Patel
O: 832-244-6830
M: 832-244-6830
mickey@mpr.group
O: 832-244-6830
M: 832-244-6830
mickey@mpr.group
While we strive to provide the most accurate information, all listing information, and demographic data, is provided by third-parties. As such, MyEListing will not be responsible for the accuracy of the information. It is strongly recommended that you verify all information with the listing agent, and any relevant agencies, prior to making any decisions.