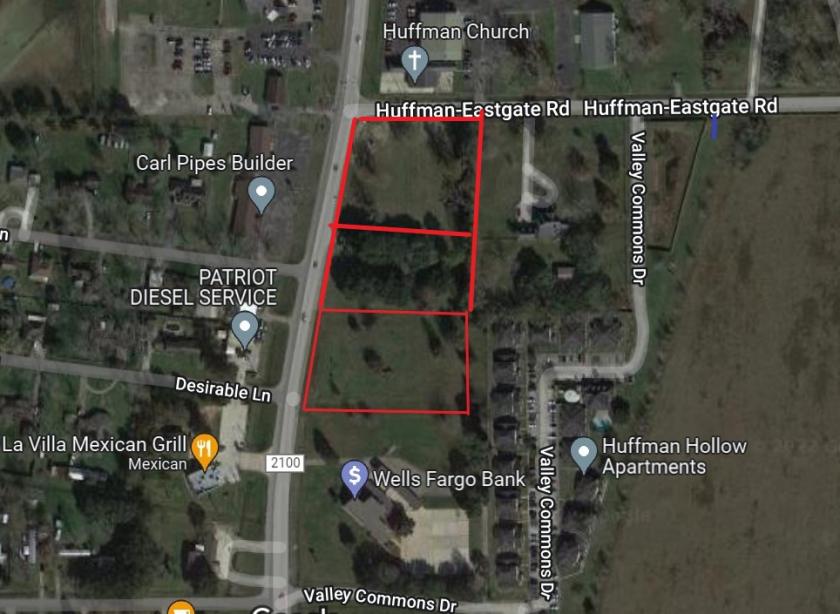
1-Mile | 3-Miles | 5-Miles | ||
---|---|---|---|---|
Total Population | 1,213 | 7,553 | 35,551 | |
Population Median Age | 39 | 39 | 40 | |
Population by Age | 0-9 Yrs | 75 (6%) | 695 (9%) | 4416 (12%) |
10-19 Yrs | 247 (20%) | 1509 (19%) | 6175 (17%) | |
20-29 Yrs | 178 (14%) | 848 (11%) | 2499 (7%) | |
30-39 Yrs | 89 (7%) | 630 (8%) | 3308 (9%) | |
40-49 Yrs | 211 (17%) | 1122 (14%) | 5795 (16%) | |
50-59 Yrs | 160 (13%) | 1078 (14%) | 4896 (13%) | |
60-69 Yrs | 121 (9%) | 843 (11%) | 4631 (13%) | |
70+ Yrs | 131 (10%) | 828 (10%) | 3830 (10%) | |
Median HH Income | $61,462 | $82,320 | $125,108 | |
Total Household Income | < 24K | 65 (14%) | 388 (14%) | 1076 (8%) |
25-49K | 124 (27%) | 500 (18%) | 1506 (11%) | |
50-74K | 49 (11%) | 342 (12%) | 1615 (12%) | |
75-99K | 50 (11%) | 393 (14%) | 1516 (11%) | |
100-199K | 104 (23%) | 602 (22%) | 4050 (31%) | |
200K+ | 53 (11%) | 465 (17%) | 3142 (24%) | |
Highest Education Level | No Diploma | 120 | 526 | 1513 |
Diploma or GED | 248 | 1317 | 4184 | |
Some College | 247 | 1359 | 4942 | |
Assoc. Degree | 40 | 454 | 2040 | |
Bachelors Degree | 71 | 827 | 7344 | |
Higher Degree | 63 | 384 | 3583 | |
Total Housing Units | 582 | 3,246 | 14,258 | |
--Owner-Occupied | 389 | 2,260 | 11,176 | |
--Renter-Occupied | 57 | 429 | 1,729 | |
Owner-Occupied Values | < 100K | 96 | 289 | 577 |
100-199K | 131 | 537 | 1588 | |
200-299K | 73 | 518 | 2603 | |
300-399K | 58 | 320 | 2698 | |
400-499K | 22 | 162 | 1610 | |
500K+ | 9 | 434 | 2100 | |
Total Working Age Population | 987 | 5,849 | 27,118 | |
In Work Force | 577 | 3,509 | 16,422 | |
Not In Work Force | 410 | 2,340 | 10,696 | |
Workforce Employed | 493 | 3,180 | 15,478 | |
Workforce Unemployed | 85 | 329 | 865 | |
Civlian Workforce | 577 | 3,509 | 16,343 | |
Military Workforce | 0 | 0 | 79 | |
Total Households | 445 | 2,689 | 12,905 | |
Family Households | 344 | 2,200 | 10,221 | |
Non-Family Households | 101 | 489 | 2,685 | |
Married Couple | 259 | 1,692 | 8,723 | |
Other Family | 85 | 508 | 1,497 | |
Married w/Child | 64 | 524 | 3,699 | |
Single Male w/Child | 0 | 19 | 121 | |
Single Female w/Child | 61 | 375 | 843 |
Population Change Last Two Decades - Plus Projection
2000 | % | 2010 | % | 2020 | % | 2030 | |
---|---|---|---|---|---|---|---|
Texas | 20,851,820 | +21 | 25,145,561 | +16 | 29,145,505 | +13 | 32,912,882 |
Harris County | 3,400,578 | +20 | 4,092,459 | +16 | 4,731,145 | +10 | 5,226,744 |
Liberty County | 70,154 | +8 | 75,643 | +21 | 91,628 | +17 | 107,321 |
Total Working Age Population:
Total Households:
Total Working Age Population:
Total Households:
Total Working Age Population:
Total Households: